Junk Charts
  • About
  • RSS
  • Posts by Year
  • Posts by Keywords
Sign in Subscribe

line chart

Logging a sleight of hand
Axis

Logging a sleight of hand

Breaking down a sleight of hand when using log transforms
Read More
Aligning the visual and the message
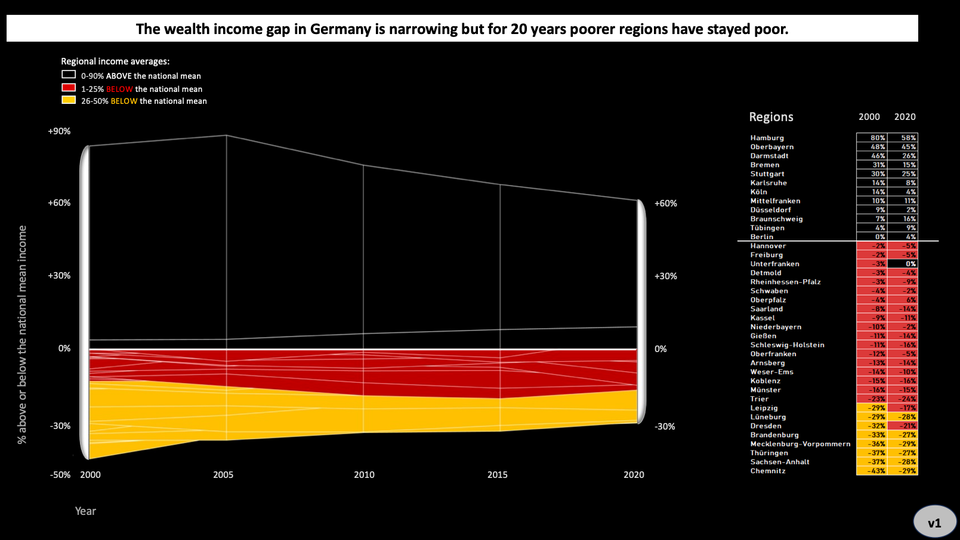
ray vella

Aligning the visual and the message

Student of Ray Vella's NYU class produces a delightful project
Read More
The reckless practice of eyeballing trend lines
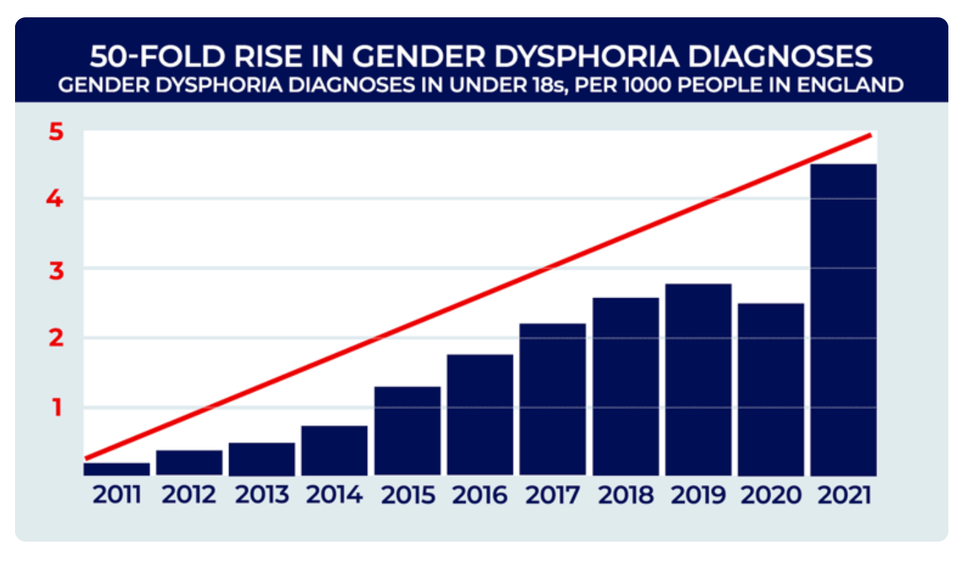
Bar chart

The reckless practice of eyeballing trend lines

The reckless practice of eyeballing trend lines
Read More
Organizing time-stamped data
Aggregation

Organizing time-stamped data

Re-organizing the time stamps of Elon Musk tweets
Read More
Two challenging charts showing group distributions
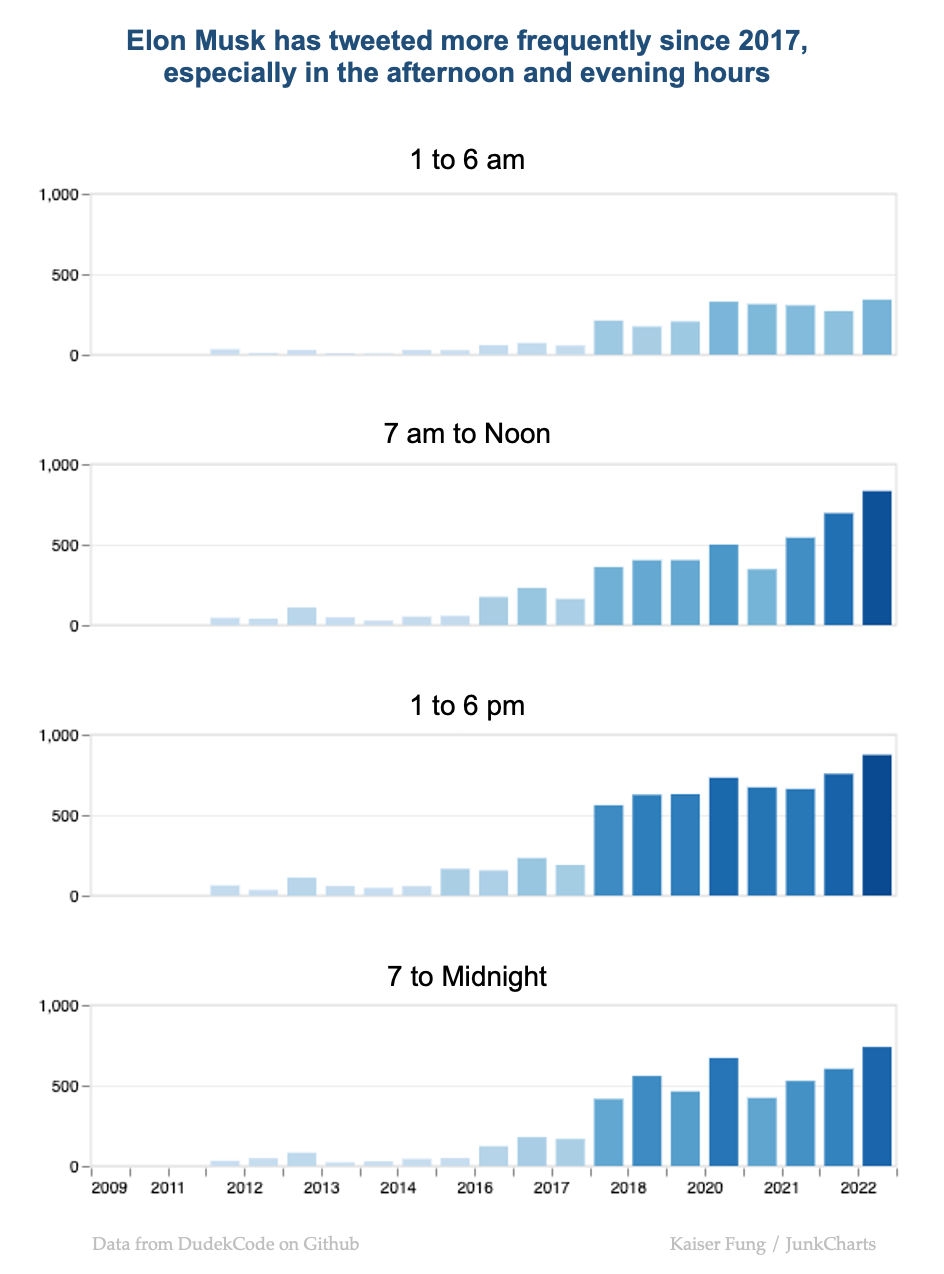
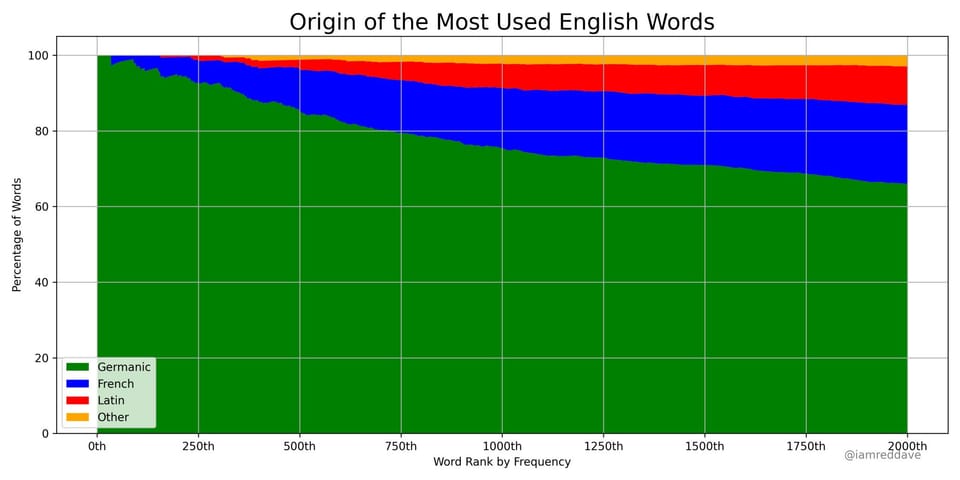
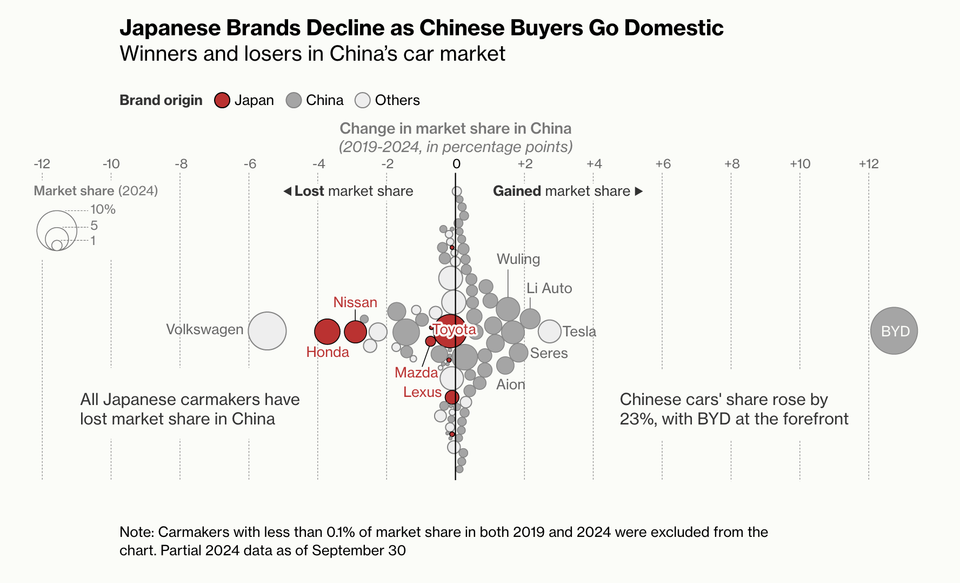
Area chart

Two challenging charts showing group distributions

Two complex charts that show subgroup distributions of data
Read More
Dot plots with varying dot sizes
Aggregation

Dot plots with varying dot sizes

An example of a dot plot with varying dot sizes
Read More
← Newer Posts Page 3 of 17 Older Posts →
Junk Charts © 2026
  • BOOKS
  • COURSES
  • PRESS
  • CONSULTING
  • COACHING
  • CONTACT
Powered by Ghost