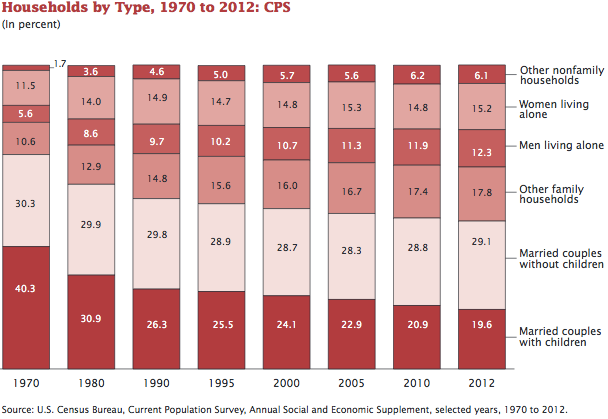
Bar chart The inutility of stacking columns When I see a stacked column chart like this: (via Andrew Sullivan)
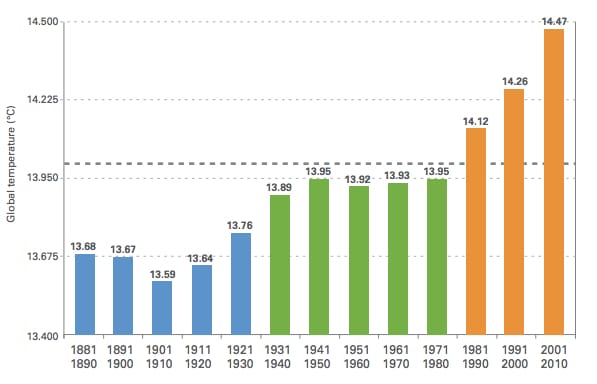
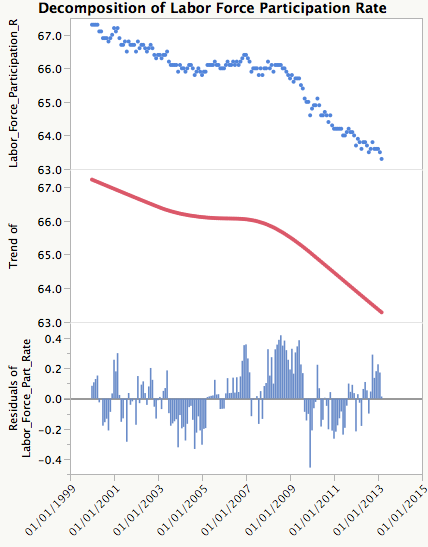
Axis Look what I found: two amazing charts While doing some research for my statistics blog, I came across a
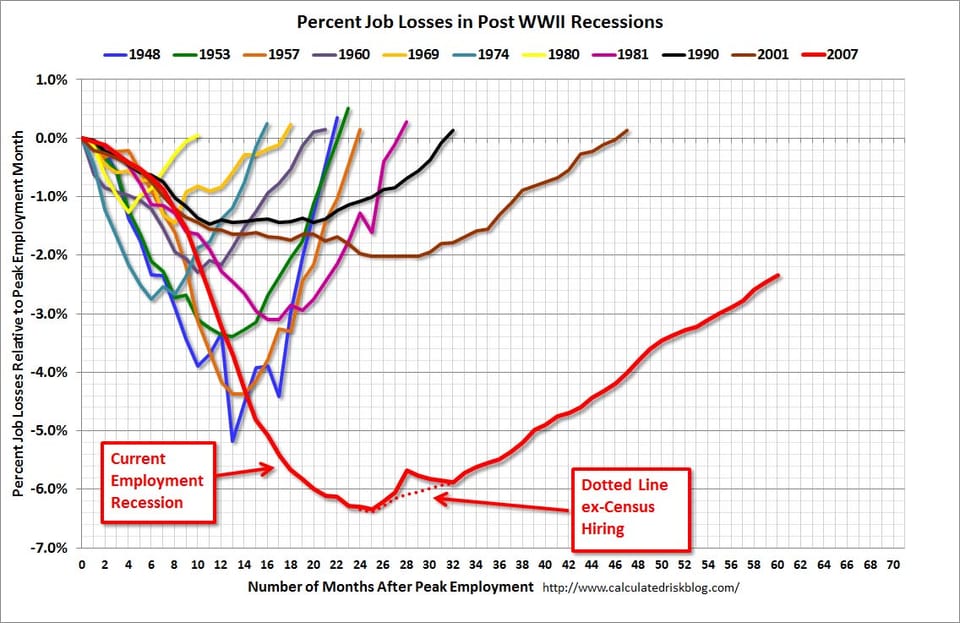
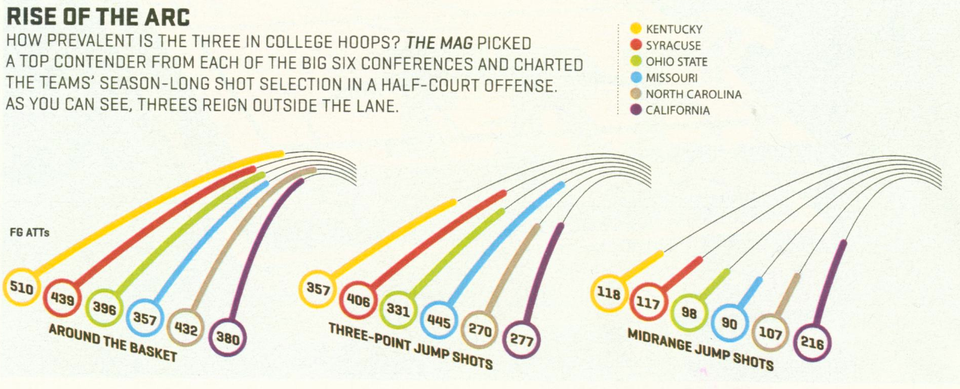
Aggregation Guess which day I made this chart ESPN Magazine issued a special analytics edition to ride the Moneyball bandwagon.