Junk Charts
About
RSS
Posts by Year
Posts by Keywords
Sign in
Subscribe
london
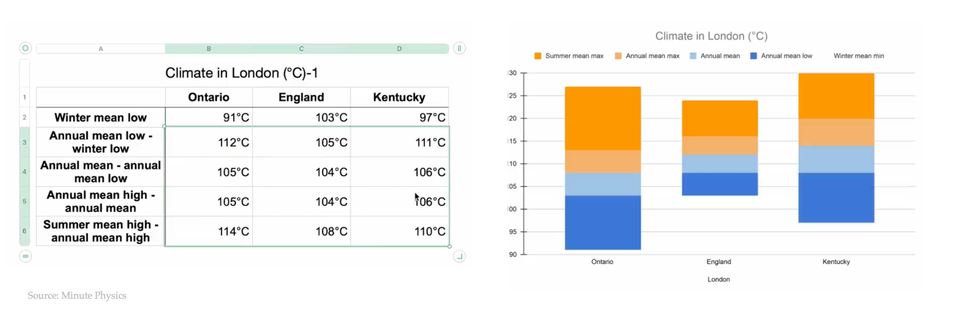
Boxplot
Five-value summaries of distributions
Using five numbers ot summarize data distributions
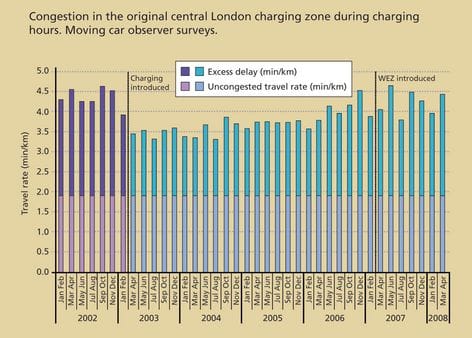
Bar chart
Excess delay
Kaiser finds a chart that analyzes London's congestion charging programme.
Page 1 of 1