Junk Charts
About
RSS
Posts by Year
Posts by Keywords
Sign in
Subscribe
Map
Aggregation
The trouble with maps
Todd B. pointed us here. These are maps that supposedly show the
Blogs
How to read a graph
Via Gelman, here is a nifty book-buying map from Amazon, displaying
Background
Political theater
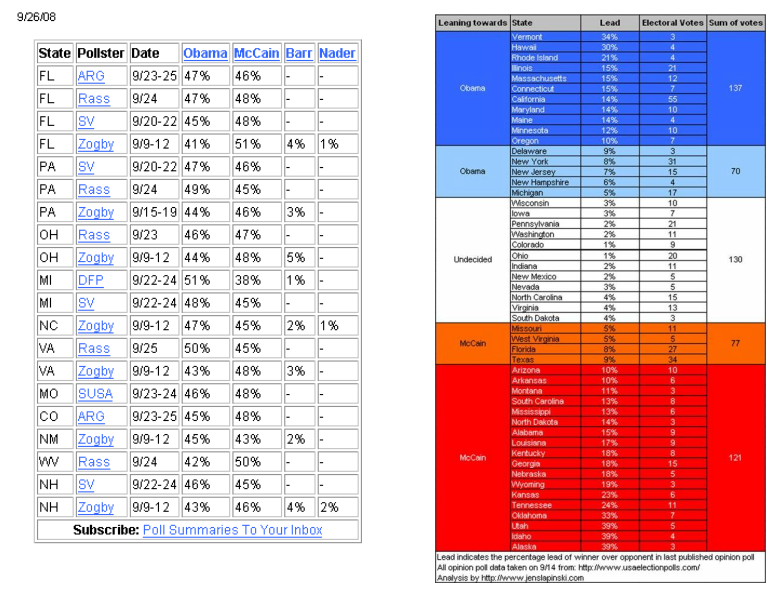
Jens, a long-time reader, tried to re-make the boring data
Aggregation
Loss aversion
Loss aversion manifests itself in chart-making, as it does in economics.
Axis
Lining things up
Guess where I went for vacation (clue in the chart). This long,
Axis
Olympic tallies
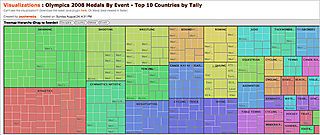
Andrew N., a reader from Australia, wasn't too impressed with
←
Newer Posts
Page 8 of 9
Older Posts
→