Junk Charts
  • About
  • RSS
  • Posts by Year
  • Posts by Keywords
Sign in Subscribe

measurement

Displaying convoluted indices
ray vella

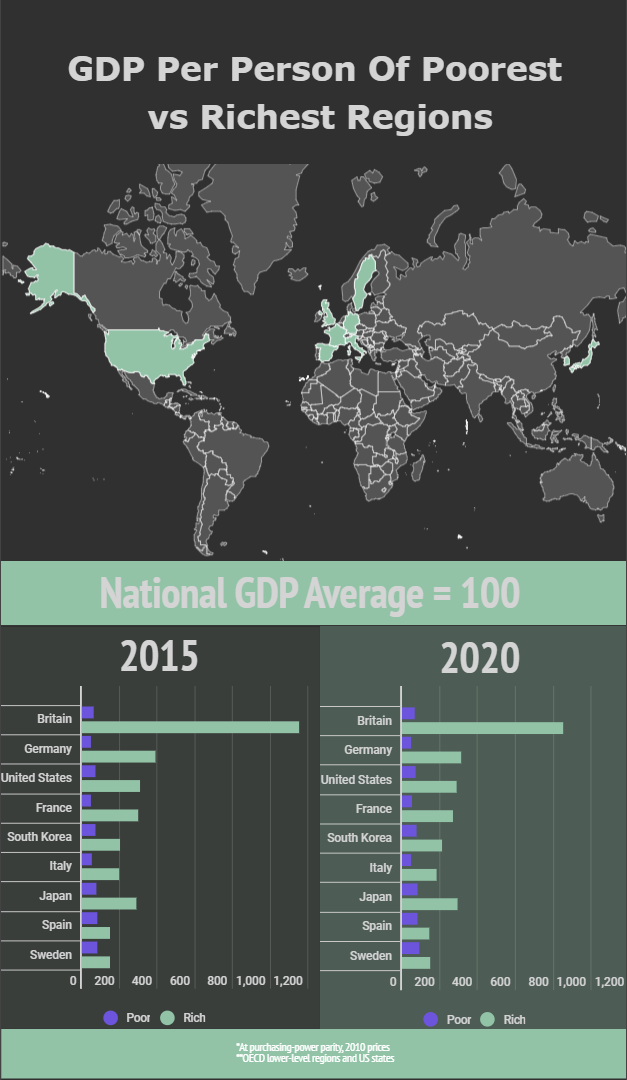
Displaying convoluted indices

Kaiser shows how a small change in structure clarifies comparisons on a data visualization project.
Read More
← Newer Posts Page 5 of 5
Junk Charts © 2026
  • BOOKS
  • COURSES
  • PRESS
  • CONSULTING
  • COACHING
  • CONTACT
Powered by Ghost