Junk Charts
  • About
  • RSS
  • Posts by Year
  • Posts by Keywords
Sign in Subscribe

metrics

Avinash's scoring rubric for data visualization
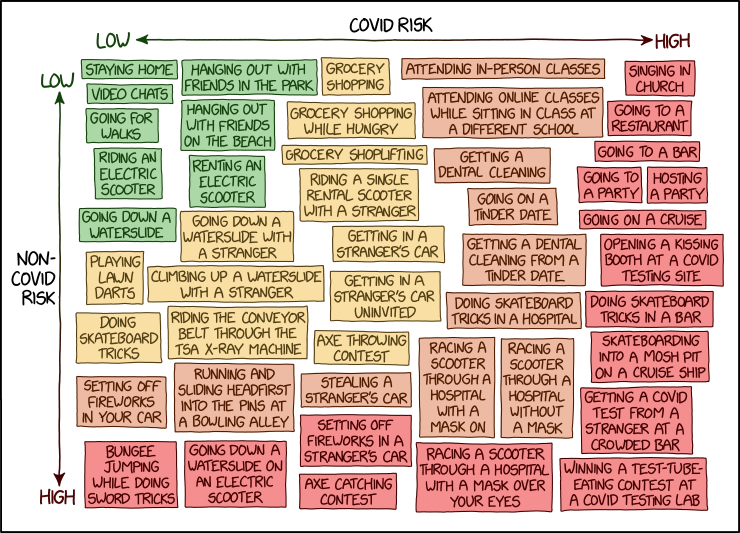
data visualization

Avinash's scoring rubric for data visualization

Eight ingredients of great graphics
Read More
Simple is not always easy
Bar chart

Simple is not always easy

Simple design is not always easy
Read More
Story-first governing
story-first

Story-first governing

Pay for performance, story-firsters, and trust in statistics
Read More
P esteem, bosom peril, flag to clamor, and anti-tech tech
Algorithms

P esteem, bosom peril, flag to clamor, and anti-tech tech

Kaiser reads about p esteems, bosom perils, and flag to clamor.
Read More
What is AB testing? 2
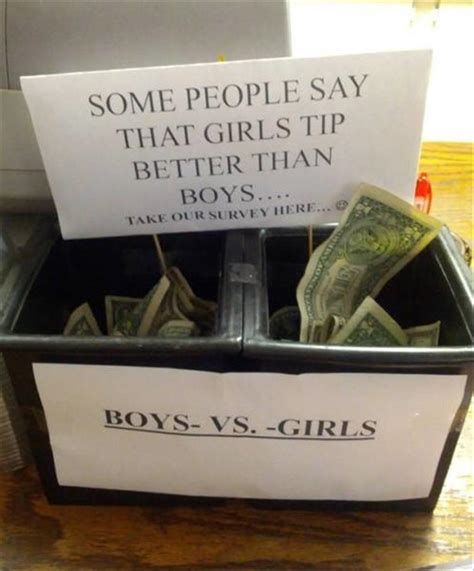
Analytics-business interaction

What is AB testing? 2

Kaiser muses about the state of AB testing in 2022
Read More
Manufacturing statistics, US News style
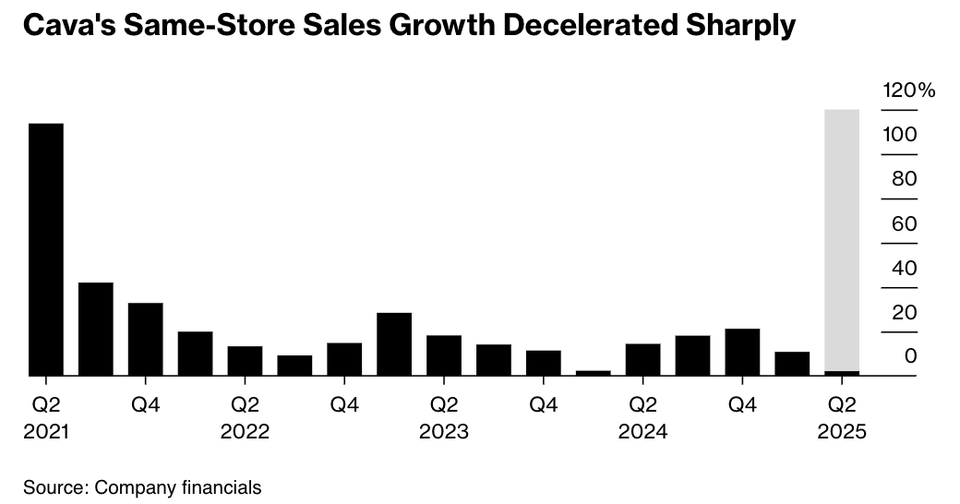
Business

Manufacturing statistics, US News style

Kaiser looks at another report of an elite college gaming the rankings.
Read More
Page 1 of 2 Older Posts →
Junk Charts © 2026
  • BOOKS
  • COURSES
  • PRESS
  • CONSULTING
  • COACHING
  • CONTACT
Powered by Ghost