Junk Charts
  • About
  • RSS
  • Posts by Year
  • Posts by Keywords
Sign in Subscribe

NYT

Turnout tuneout
interaction

Turnout tuneout

A clever scatter plot reveals an interaction
Read More
An abstract chart only statisticians love
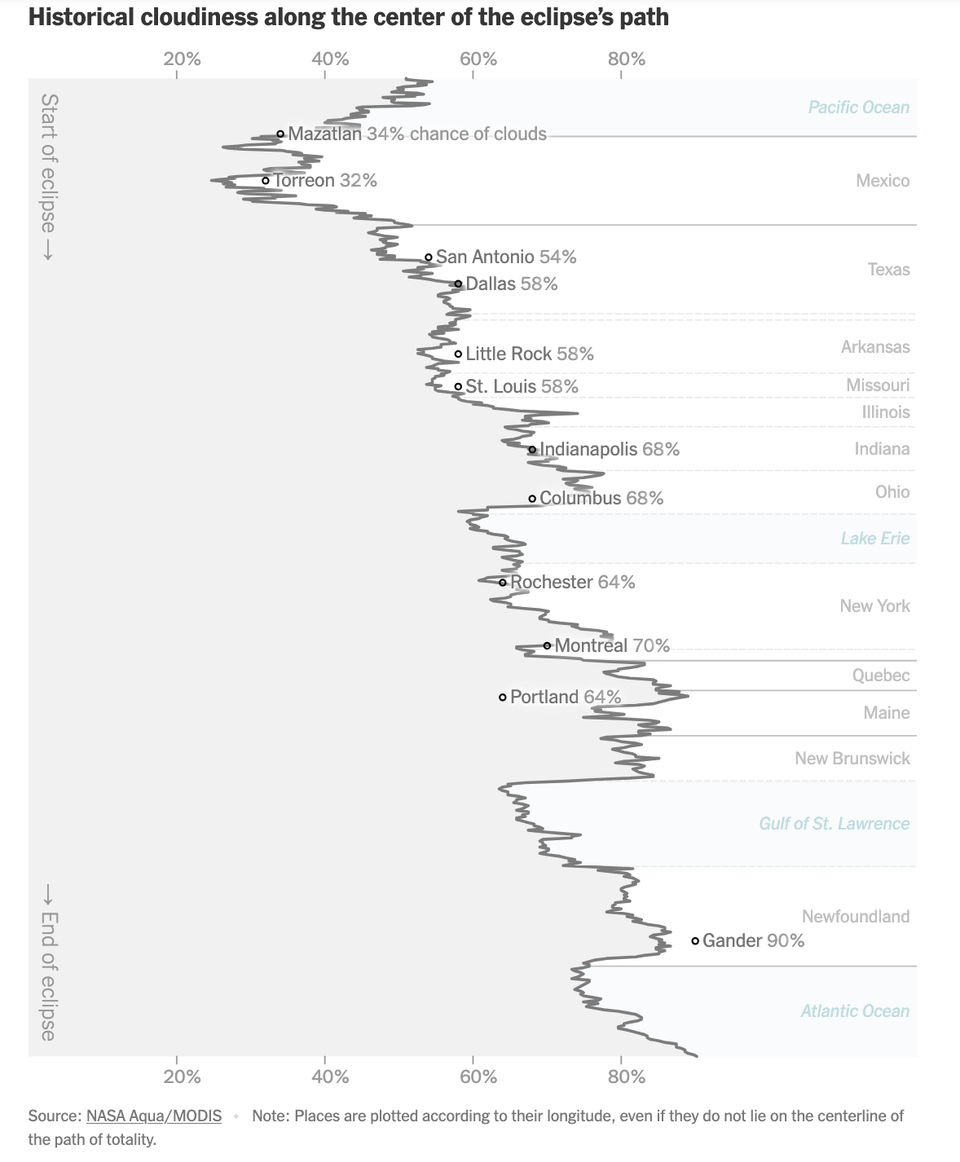
line chart

An abstract chart only statisticians love

The NYT made this abstract chart about clouds on full eclipse day
Read More
There is a time and a place for every shadow and cloud
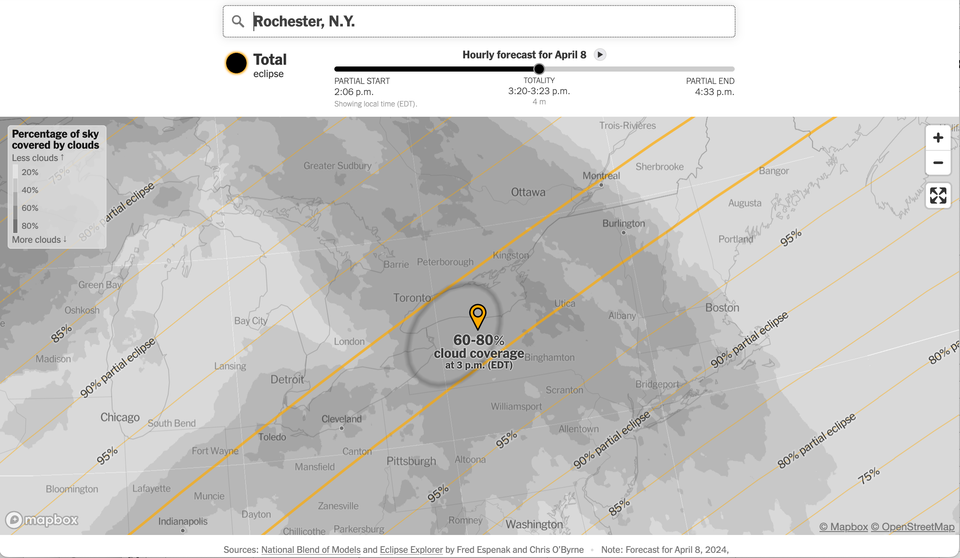
NYT

There is a time and a place for every shadow and cloud

A beautiful NYT project masterfully handling time and space dynamics
Read More
The canonical U.S. political map
Map

The canonical U.S. political map

What makes the canonical US elections map work?
Read More
Gaining precision by deleting data
Current affairs

Gaining precision by deleting data

How to gain precision by deleting data
Read More
Visualizing extremes
Aggregation

Visualizing extremes

Nice NYT chart showing weather extremes
Read More
Page 1 of 10 Older Posts →
Junk Charts © 2025
  • BOOKS
  • COURSES
  • PRESS
  • CONSULTING
  • COACHING
  • CONTACT
Powered by Ghost