Junk Charts
  • About
  • RSS
  • Posts by Year
  • Posts by Keywords
Sign in Subscribe

NYT

Visualizing extremes
Aggregation

Visualizing extremes

Nice NYT chart showing weather extremes
Read More
Neither the forest nor the trees
Business

Neither the forest nor the trees

Kaiser attempts to read a treemap of stock market values.
Read More
Know your data 31: Wordle, and NYT
Analytics-business interaction

Know your data 31: Wordle, and NYT

Kaiser looks at the fuss behind Wordle tracking for advertisers.
Read More
Brexit, Bremain, the world did not end so dataviz people can throw shade and color
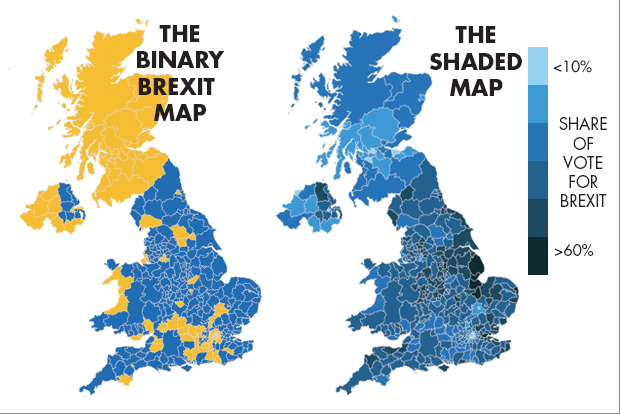
Aggregation

Brexit, Bremain, the world did not end so dataviz people can throw shade and color

Pick your own distortion
Read More
Painting the full picture of the employment situation
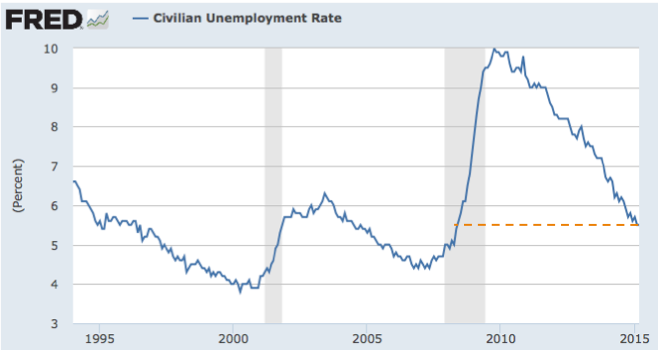
Aggregation

Painting the full picture of the employment situation

It's very frustrating to read the mainstream articles about the
Read More
Relevance, to you or me: a response to Cairo
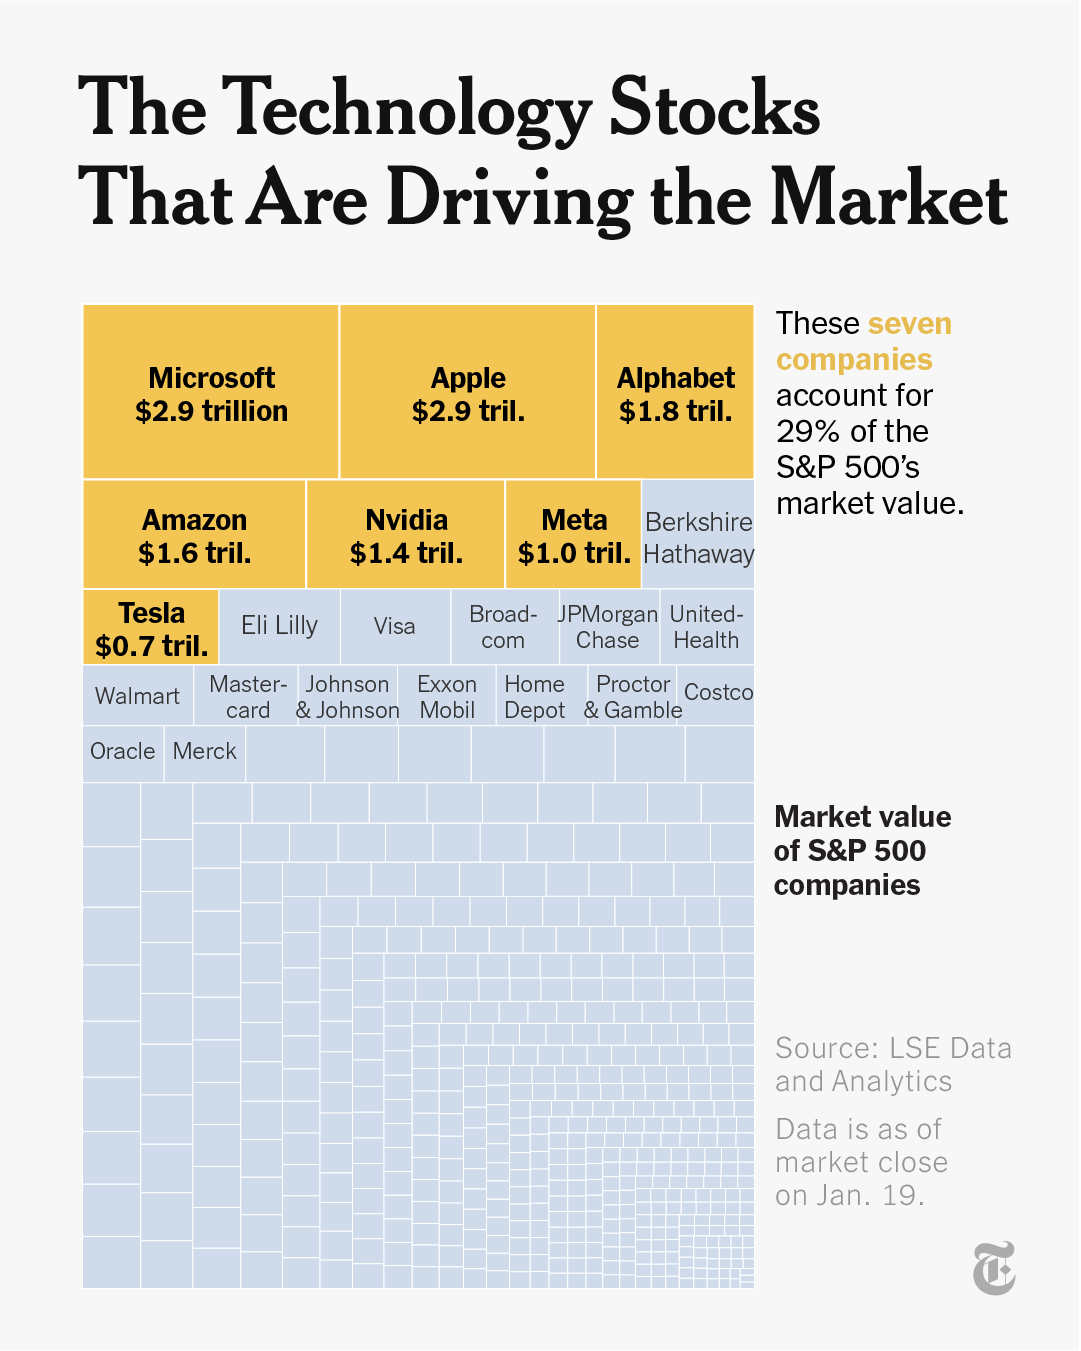
Aggregation

Relevance, to you or me: a response to Cairo

Alberto Cairo discussed a graphic by the New York Times on the
Read More
← Newer Posts Page 2 of 11 Older Posts →
Junk Charts © 2025
  • BOOKS
  • COURSES
  • PRESS
  • CONSULTING
  • COACHING
  • CONTACT
Powered by Ghost