Junk Charts
About
RSS
Posts by Year
Posts by Keywords
Sign in
Subscribe
Politics
Statisticians
The way of the statistician
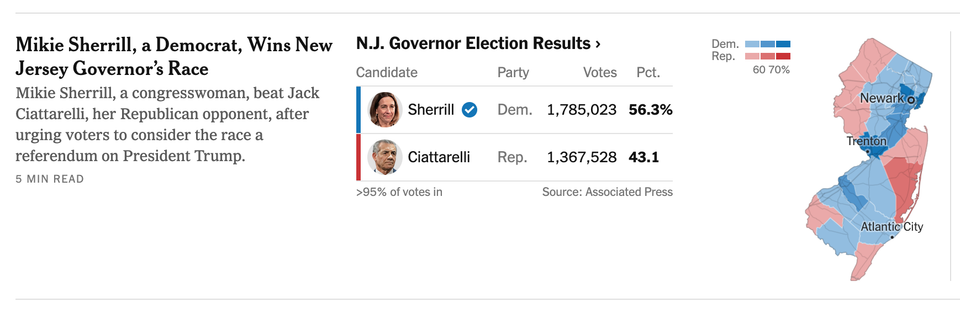
It wasn't that close after all
interaction
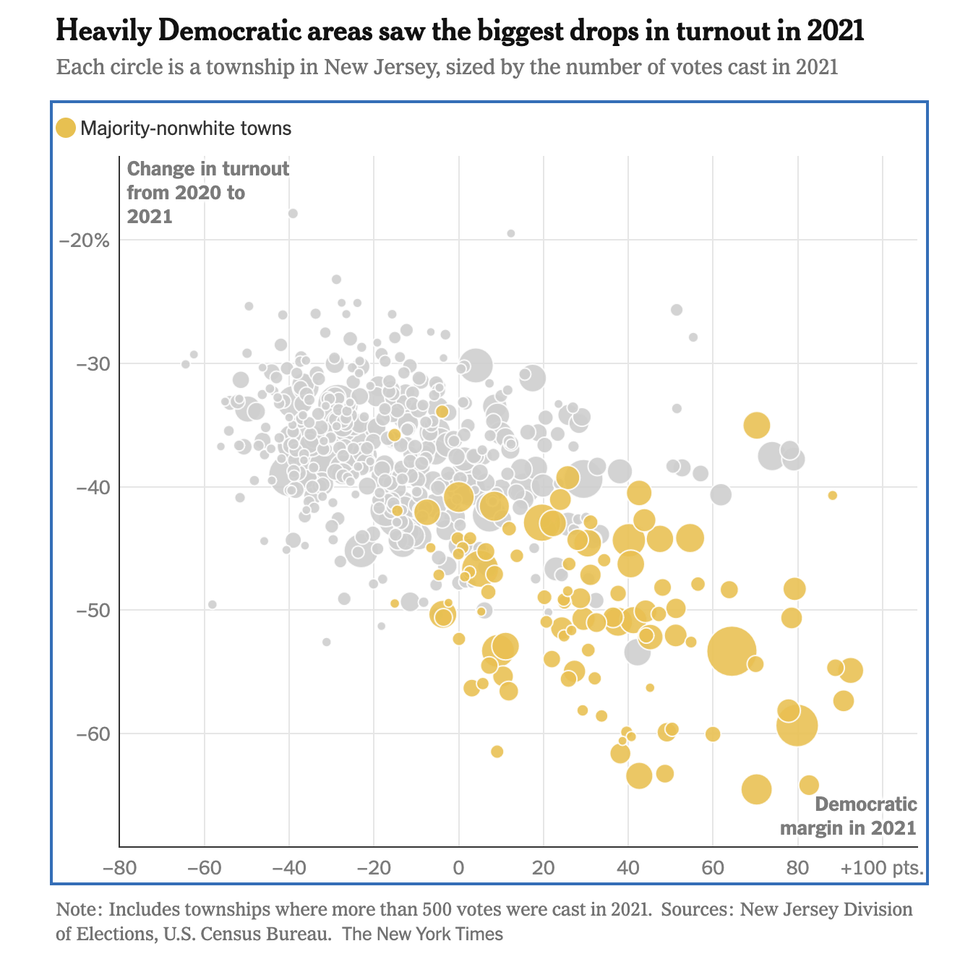
Turnout tuneout
A clever scatter plot reveals an interaction
Aggregation
Applying the band-aid, missing the wound
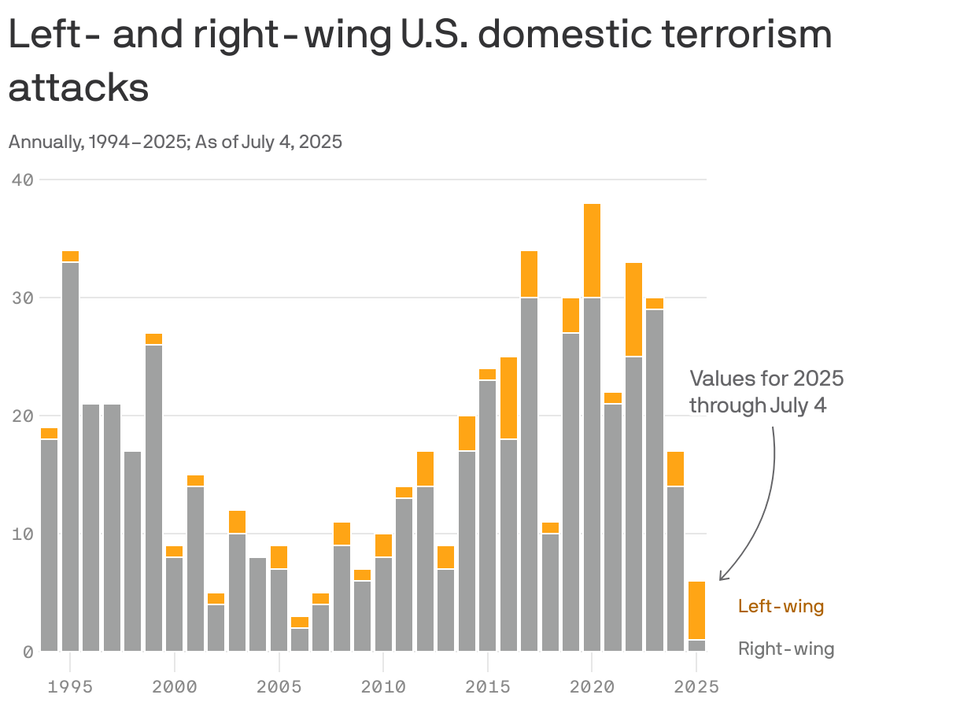
Common mistakes in stacked column charts
story-first
Story-first governing
Pay for performance, story-firsters, and trust in statistics
Analytics-business interaction
Say goodbye to soccer
Say goodbye to soccer, hello football
Business
Who pays the tariff?
Who pays the tariff? The seller or the customer?
←
Newer Posts
Page 3 of 13
Older Posts
→