Junk Charts
  • About
  • RSS
  • Posts by Year
  • Posts by Keywords
Sign in Subscribe

Scale

Visualizing hierarchies
sports analytics

Visualizing hierarchies

Bonus: setting gridlines on a circular chart
Read More
Forced roommates, favoritism, and more in data visualization
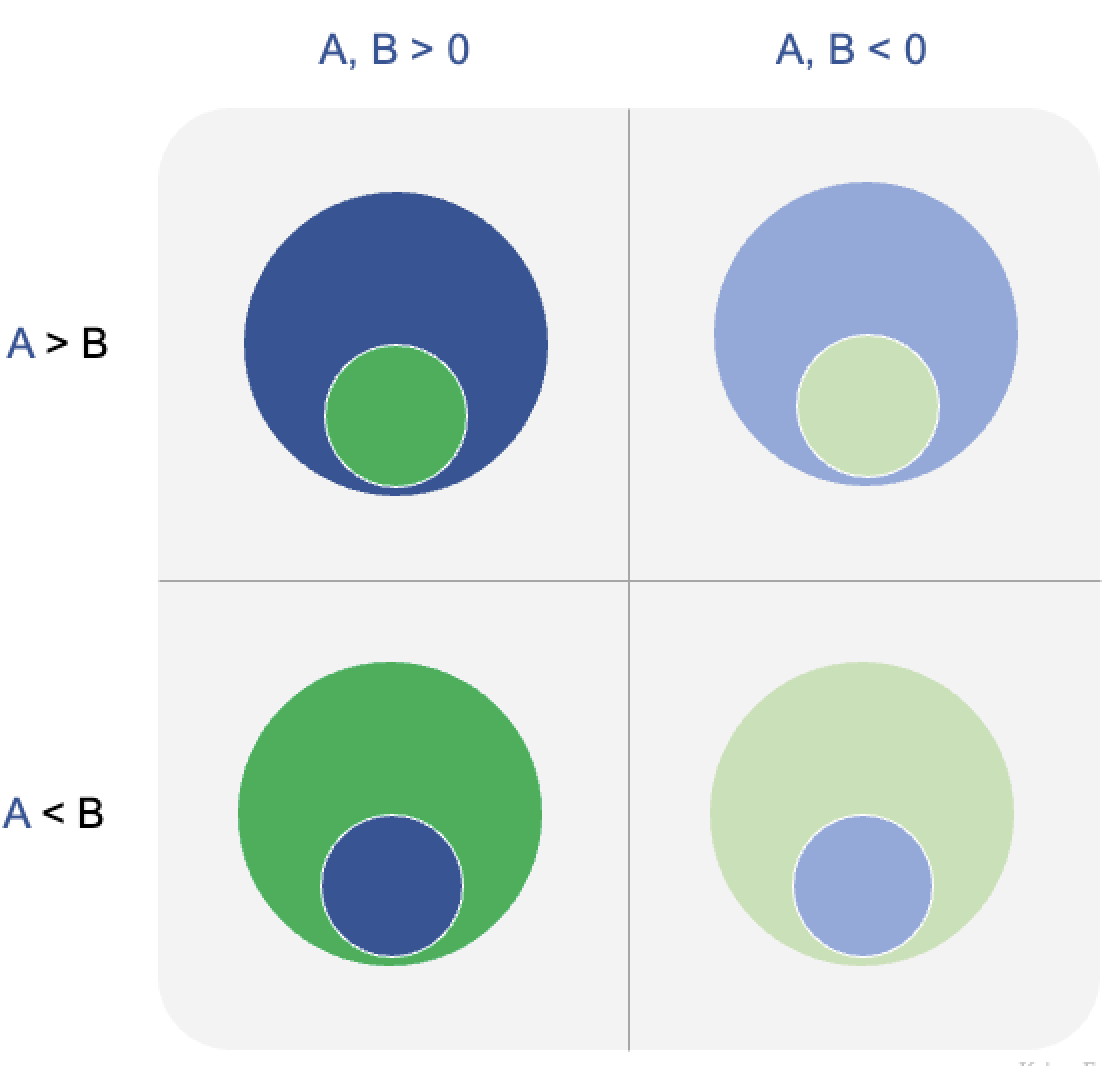
dual axes

Forced roommates, favoritism, and more in data visualization

Why is this dual-axes chart so taxing to read?
Read More
Let's be Finn-icky
statistical literacy

Let's be Finn-icky

Excellent project for data graphics literacy
Read More
There is a time and a place for every shadow and cloud
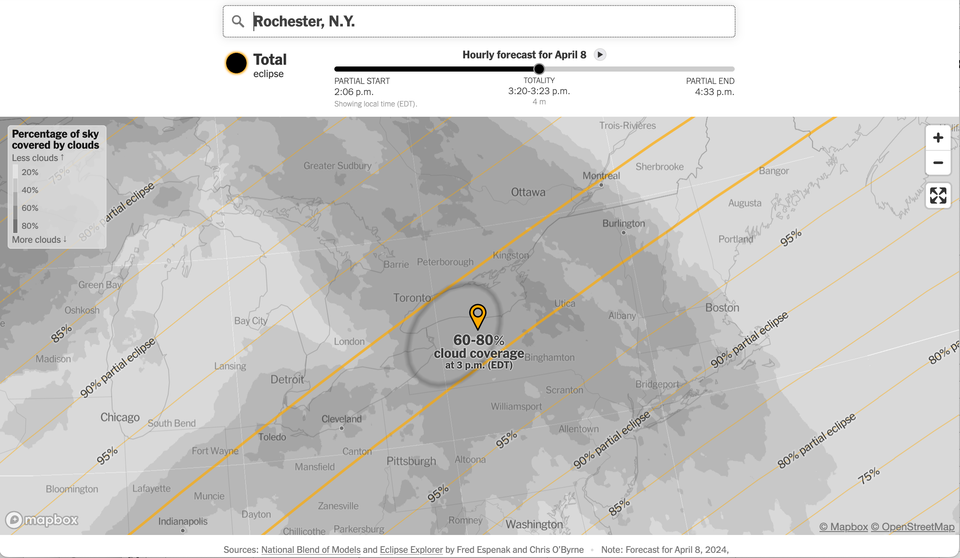
NYT

There is a time and a place for every shadow and cloud

A beautiful NYT project masterfully handling time and space dynamics
Read More
Reflection on two design quirks
Bar chart

Reflection on two design quirks

Slanting and breaking columns
Read More
Simple is not always easy
Bar chart

Simple is not always easy

Simple design is not always easy
Read More
Page 1 of 13 Older Posts →
Junk Charts © 2026
  • BOOKS
  • COURSES
  • PRESS
  • CONSULTING
  • COACHING
  • CONTACT
Powered by Ghost