artificial intelligence Will AI make cheaters of us all? Fake reviews by fake reviewers of fake papers by fake authors
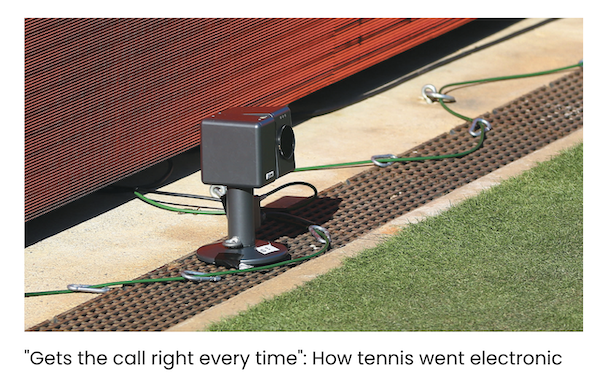
Big Data Electronic line calling vs ground truth in tennis Electronic line calling vs ground truth in tennis
Bias The dangerous story-first data analysts The dangerous story-first data analysts have grabbed the people's data