Junk Charts
  • About
  • RSS
  • Posts by Year
  • Posts by Keywords
Sign in Subscribe

Science

Bubbles of death 2
Aggregation

Bubbles of death 2

Here is an alternative way to present the death risk data.  It&
Read More
Bubbles of death
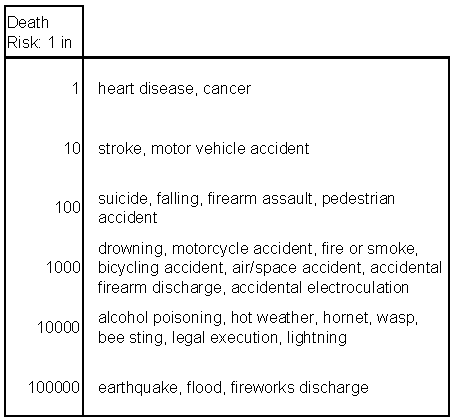
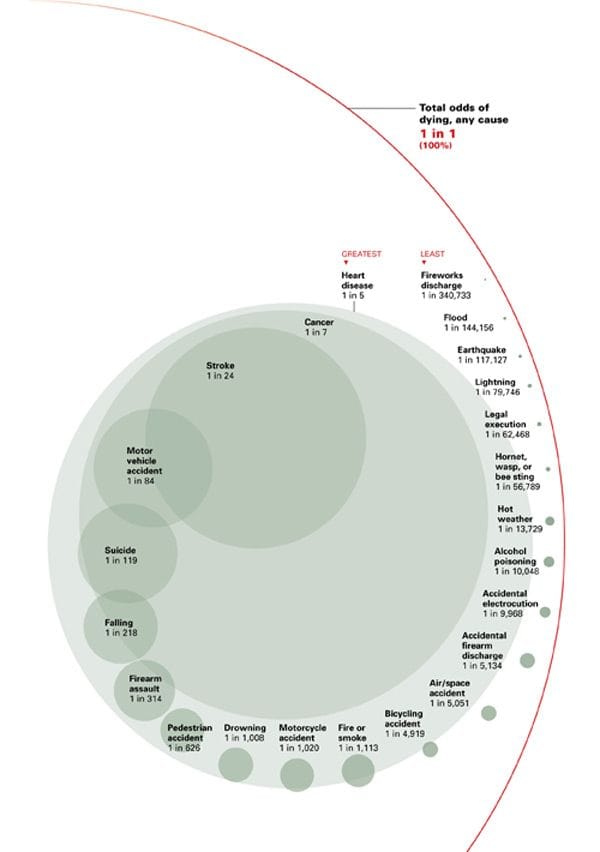
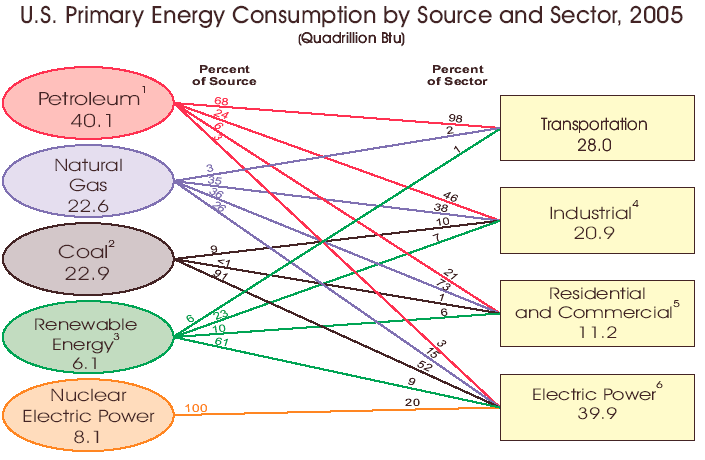
Bubble chart

Bubbles of death

Thanks to Dustin J for bringing this stupendous chart to our attention.
Read More
Losing count of Doomsday
Science

Losing count of Doomsday

The Doomsday Clock is making the news today: because of the  growing
Read More
Wading in waste
Bar chart

Wading in waste

A poor graphic leaves readers wading in waste, in this case, the
Read More
Graphical equity 1
Aggregation

Graphical equity 1

I've been slow checking my email lately: several of you
Read More
Unscientific poll?
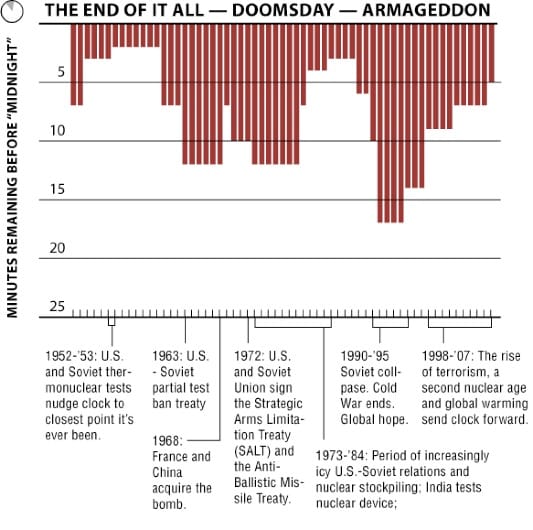
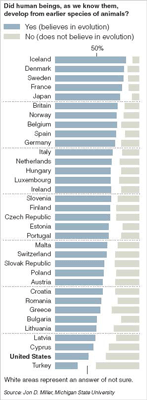
Bar chart

Unscientific poll?

This decent chart adequately brought out a, to some, shocking point that
Read More
← Newer Posts Page 29 of 30 Older Posts →
Junk Charts © 2026
  • BOOKS
  • COURSES
  • PRESS
  • CONSULTING
  • COACHING
  • CONTACT
Powered by Ghost