Junk Charts
  • About
  • RSS
  • Posts by Year
  • Posts by Keywords
Sign in Subscribe

Selection

Leaving ink traces
Area chart

Leaving ink traces

Stefan S. at the UNEP GEO Data Portal sent me some intriguing
Read More
Visualizing web statistics
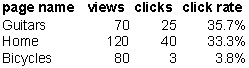
Aggregation

Visualizing web statistics

Tim inquired about: how to create an elegant graph for Web visitor
Read More
March mildness
Dot plot

March mildness

The Times published this great graphic to show 2007 was an upset-starved
Read More
Picking up the right file
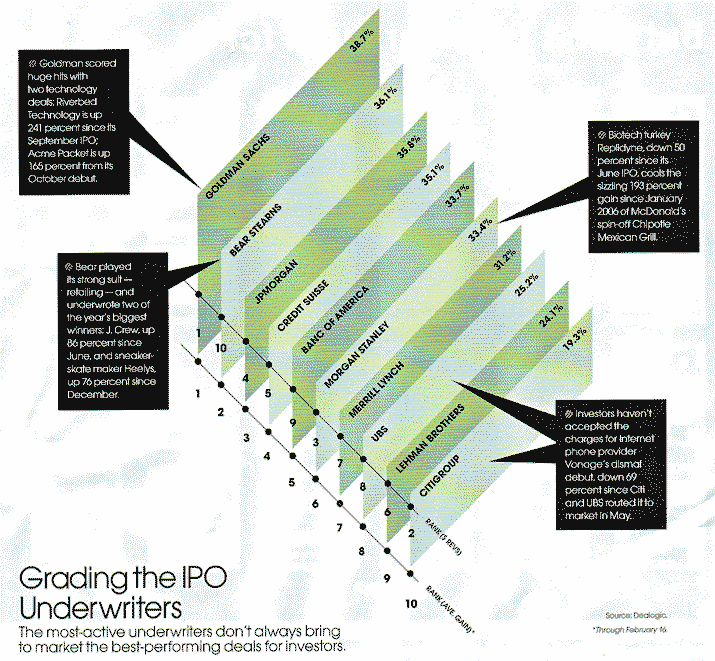
Finance

Picking up the right file

The Institutional Investor advises its readers: Going public may just be the
Read More
Convenience charting
Axis

Convenience charting

Statisticians have long riled against "convenience sampling", that is, the
Read More
Jamming
Bar chart

Jamming

Readers may have noticed that I'm not a fan of
Read More
← Newer Posts Page 2 of 3 Older Posts →
Junk Charts © 2026
  • BOOKS
  • COURSES
  • PRESS
  • CONSULTING
  • COACHING
  • CONTACT
Powered by Ghost