Junk Charts
  • About
  • RSS
  • Posts by Year
  • Posts by Keywords
Sign in Subscribe

Small multiples

Peak social media? Depends on how you measure it
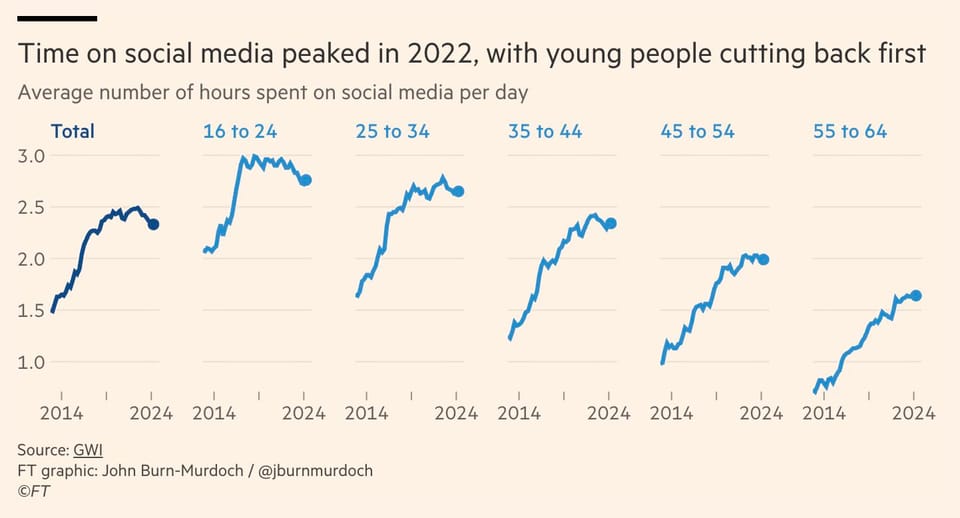
cohort

Peak social media? Depends on how you measure it

Separating individual and group effects over time
Read More
The message left the visual
Bar chart

The message left the visual

The message ran off the chart
Read More
Anti-encoding
Design

Anti-encoding

Accurate or eye-catching
Read More
Making major things easy, and minor things hard
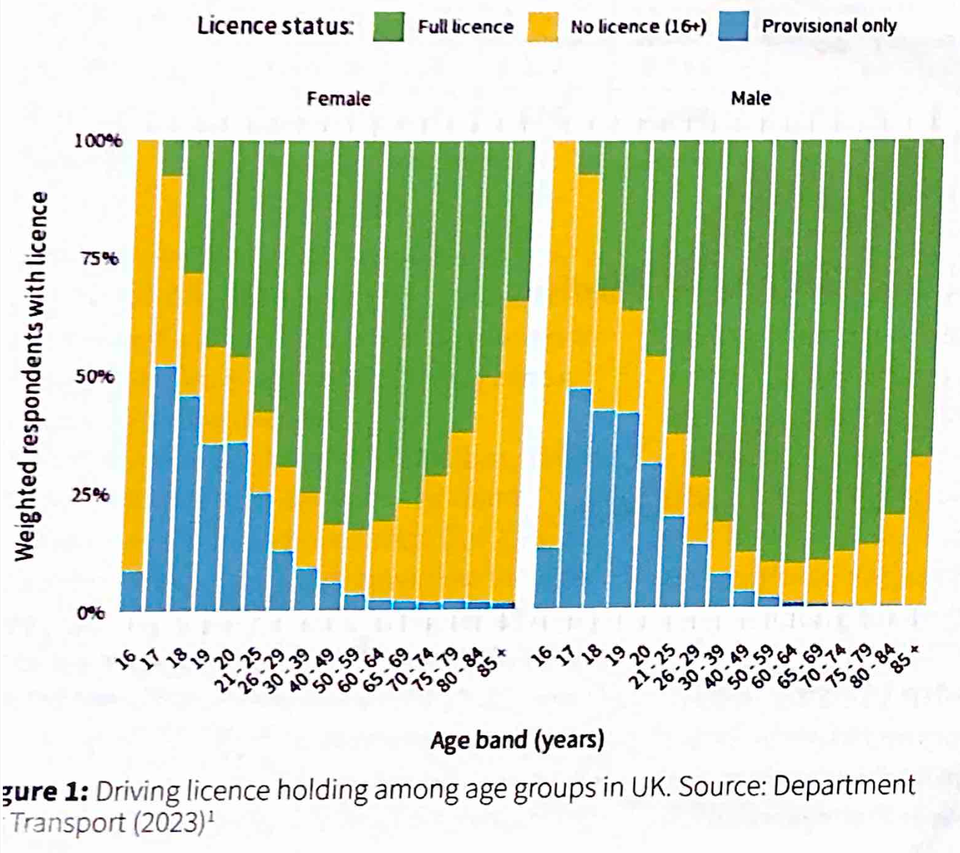
Aggregation

Making major things easy, and minor things hard

Making major things easy, and minor things hard
Read More
Deliberately obstructing chart elements as a plot point
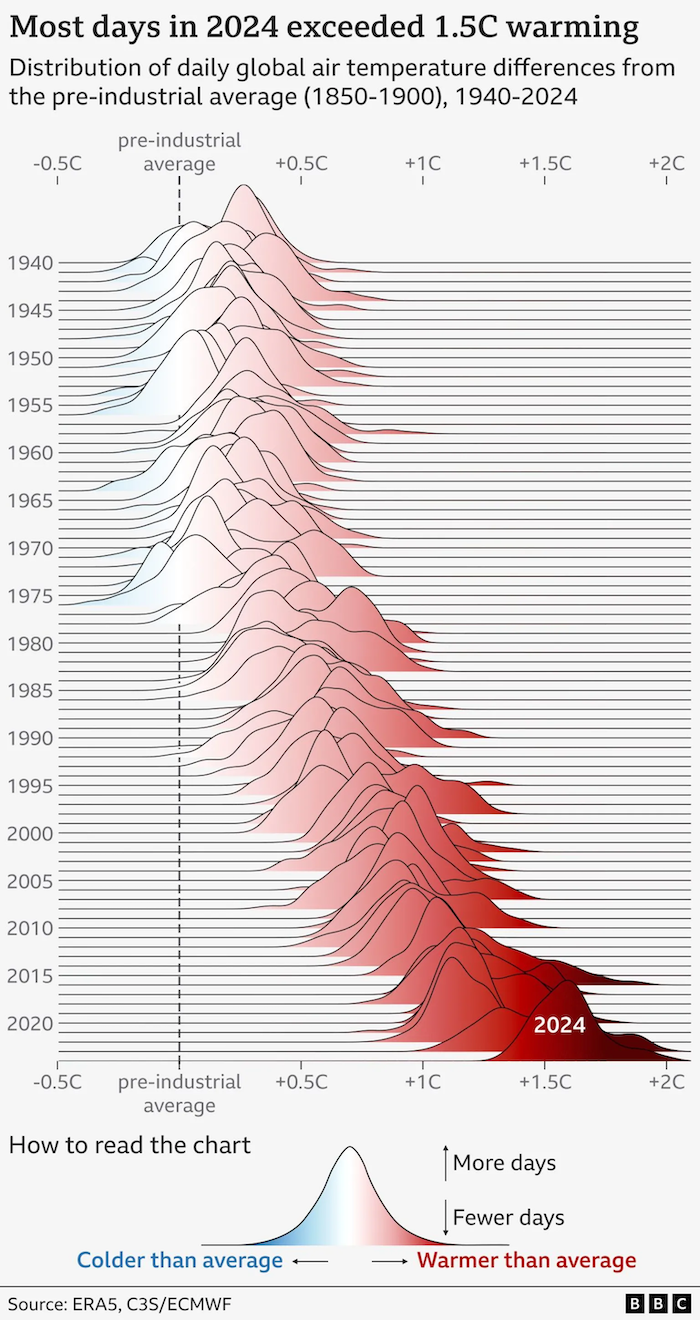
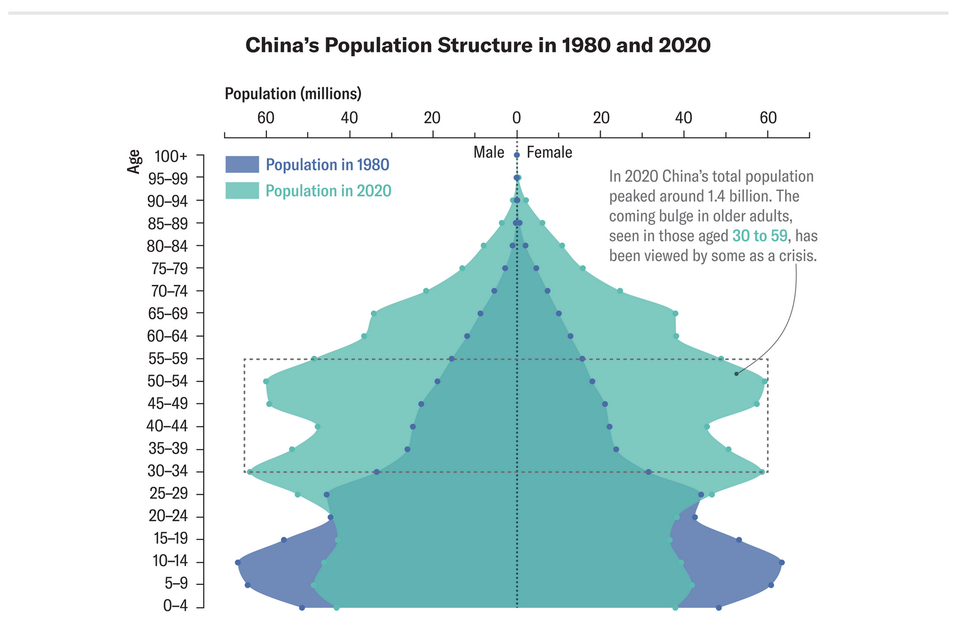
ridge plot

Deliberately obstructing chart elements as a plot point

These "ridge plots" have become quite popular in recent times.
Read More
Organizing time-stamped data
Aggregation

Organizing time-stamped data

Re-organizing the time stamps of Elon Musk tweets
Read More
Page 1 of 8 Older Posts →
Junk Charts © 2025
  • BOOKS
  • COURSES
  • PRESS
  • CONSULTING
  • COACHING
  • CONTACT
Powered by Ghost