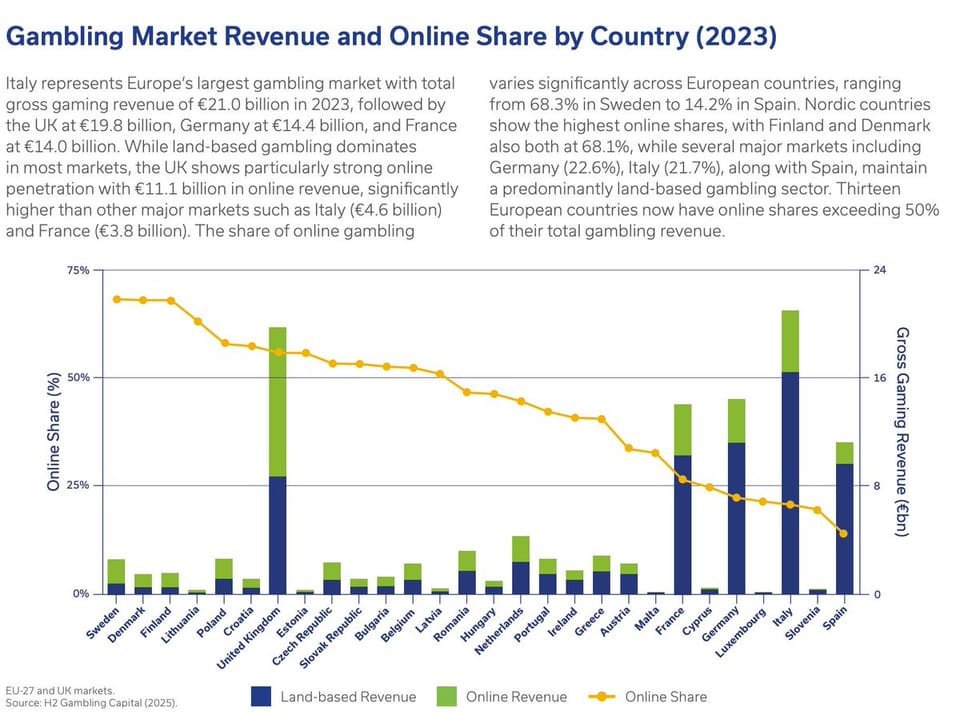
Junk Charts
  • About
  • RSS
  • Posts by Year
  • Posts by Keywords
Sign in Subscribe

Sorting

Applying the band-aid, missing the wound
Aggregation

Applying the band-aid, missing the wound

Common mistakes in stacked column charts
Read More
Color bomb
Bar chart

Color bomb

Color bomb in AI analytics
Read More
Students demonstrate how analytics underlie strong dataviz
ray vella

Students demonstrate how analytics underlie strong dataviz

Students demonstrate the value of analytics to data visualization
Read More
Decluttering charts
Clustering

Decluttering charts

Decluttering charts
Read More
Out of line
Dot plot

Out of line

Out of line
Read More
Hammock plots
hammock plot

Hammock plots

Matthias Schonlau introduces the hammock plot.
Read More
Page 1 of 9 Older Posts →
Junk Charts © 2025
  • BOOKS
  • COURSES
  • PRESS
  • CONSULTING
  • COACHING
  • CONTACT
Powered by Ghost