Junk Charts
  • About
  • RSS
  • Posts by Year
  • Posts by Keywords
Sign in Subscribe

Specialty plots

Beautiful chart to behold
data visualization

Beautiful chart to behold

Data visualization circa 1880 from Italy
Read More
Visualizing hierarchies
sports analytics

Visualizing hierarchies

Bonus: setting gridlines on a circular chart
Read More
The story on international students coming to the U.S.
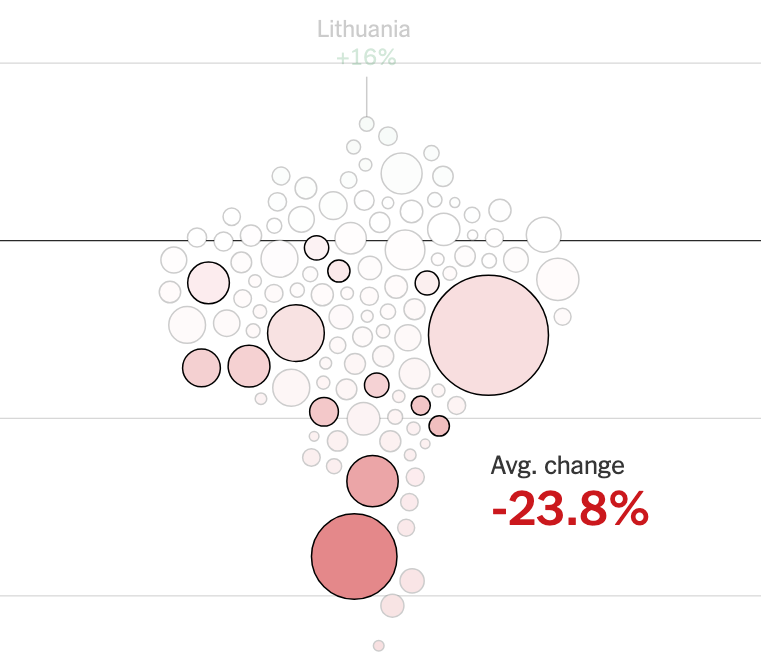
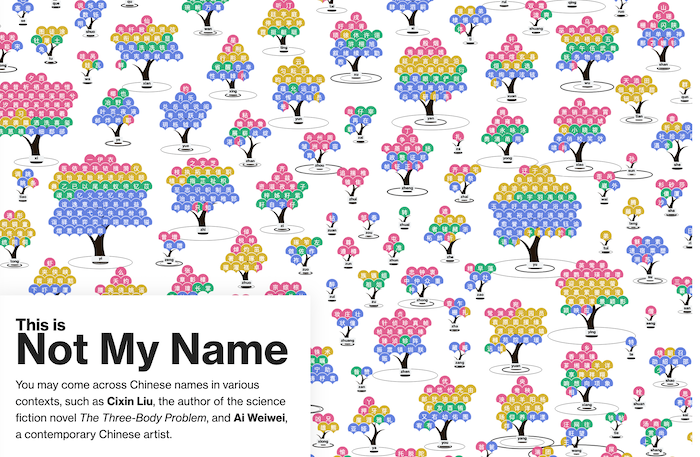
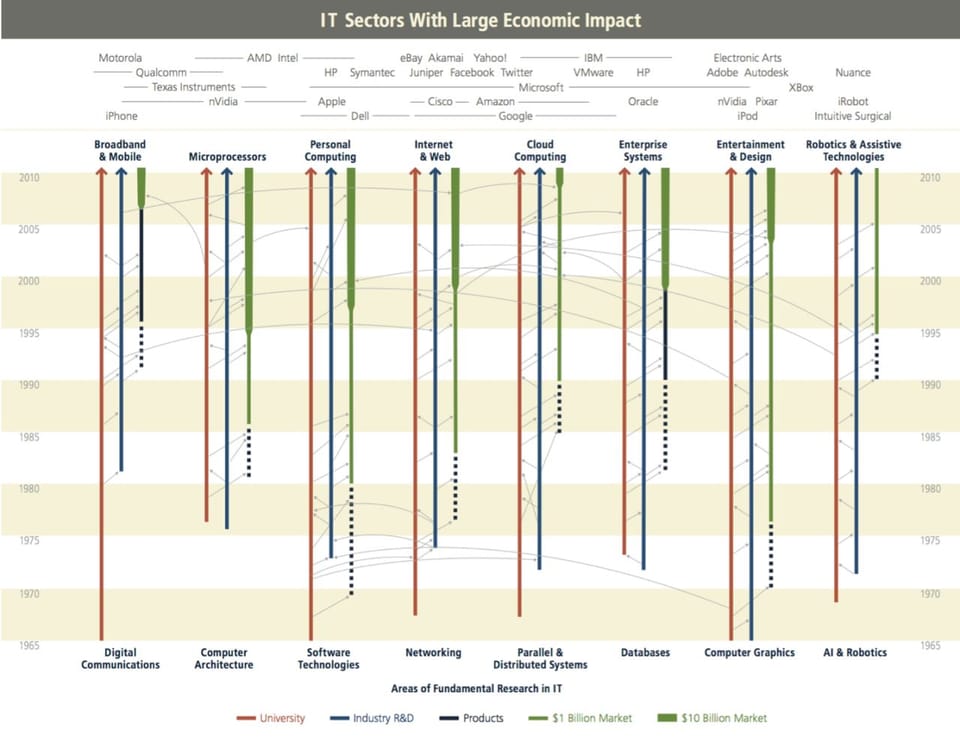
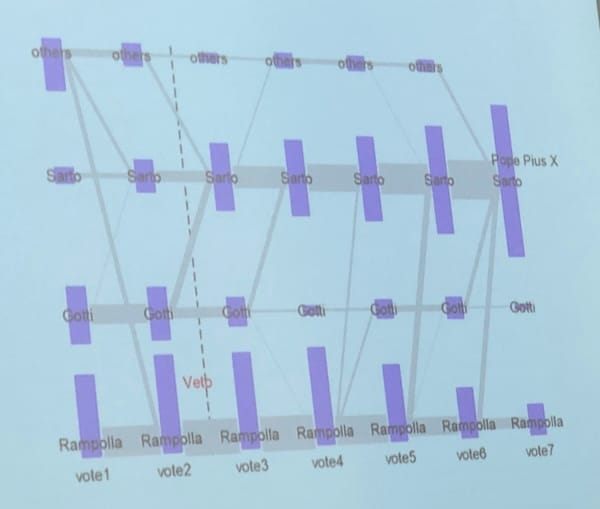
visual storytelling

The story on international students coming to the U.S.

How to visualize complex datasets
Read More
Say Jon without the h in Chinese
demographics

Say Jon without the h in Chinese

Unraveling the Chinese name puzzle
Read More
Decluttering charts
Clustering

Decluttering charts

Decluttering charts
Read More
Hammock plots
hammock plot

Hammock plots

Matthias Schonlau introduces the hammock plot.
Read More
Page 1 of 5 Older Posts →
Junk Charts © 2026
  • BOOKS
  • COURSES
  • PRESS
  • CONSULTING
  • COACHING
  • CONTACT
Powered by Ghost