Junk Charts
  • About
  • RSS
  • Posts by Year
  • Posts by Keywords
Sign in Subscribe

stacked bar chart

Fantastic auto show from the Bloomberg crew
Bar chart

Fantastic auto show from the Bloomberg crew

Bloomberg Graphics put on an auto show
Read More
Using disaggregation in dataviz
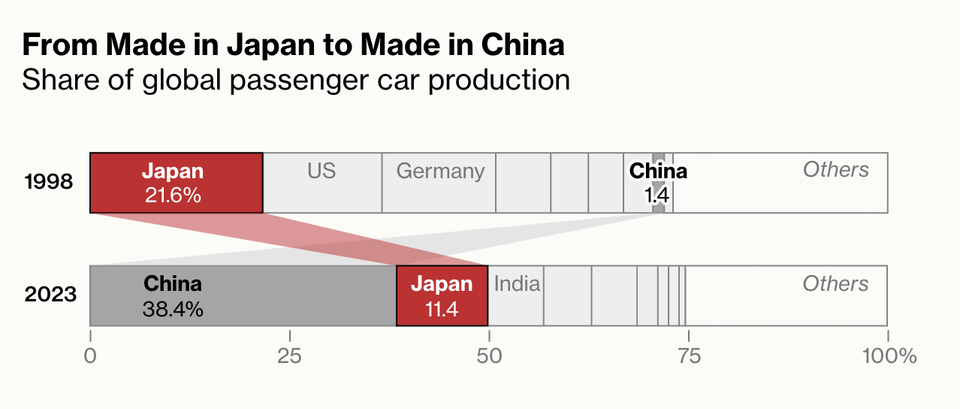
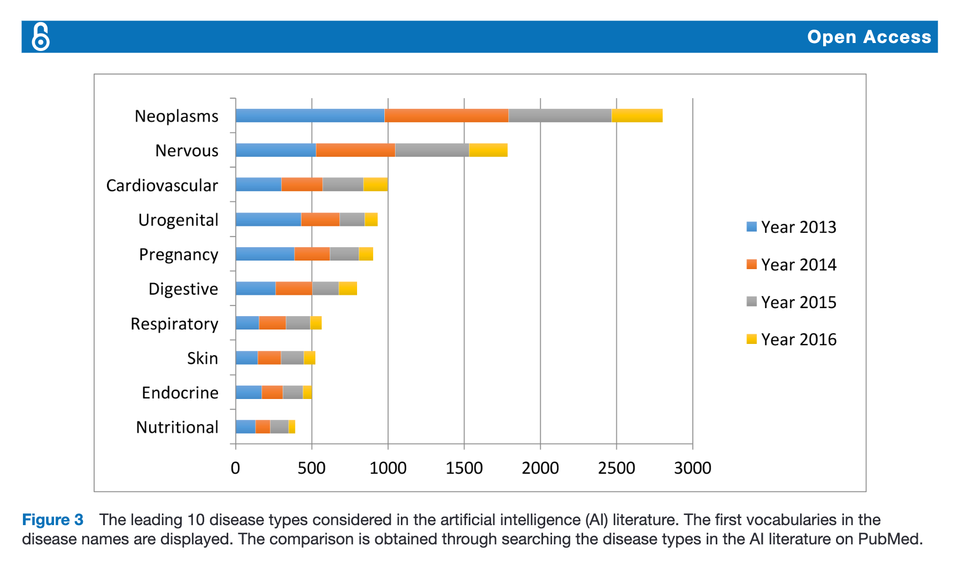
Aggregation

Using disaggregation in dataviz

Disaggregating data can be very useful when making charts
Read More
One doesn't have to plot raw data
Aggregation

One doesn't have to plot raw data

Kaiser looks at gold production worldwide.
Read More
Reading this chart won't take as long as withdrawing troops from Afghanistan
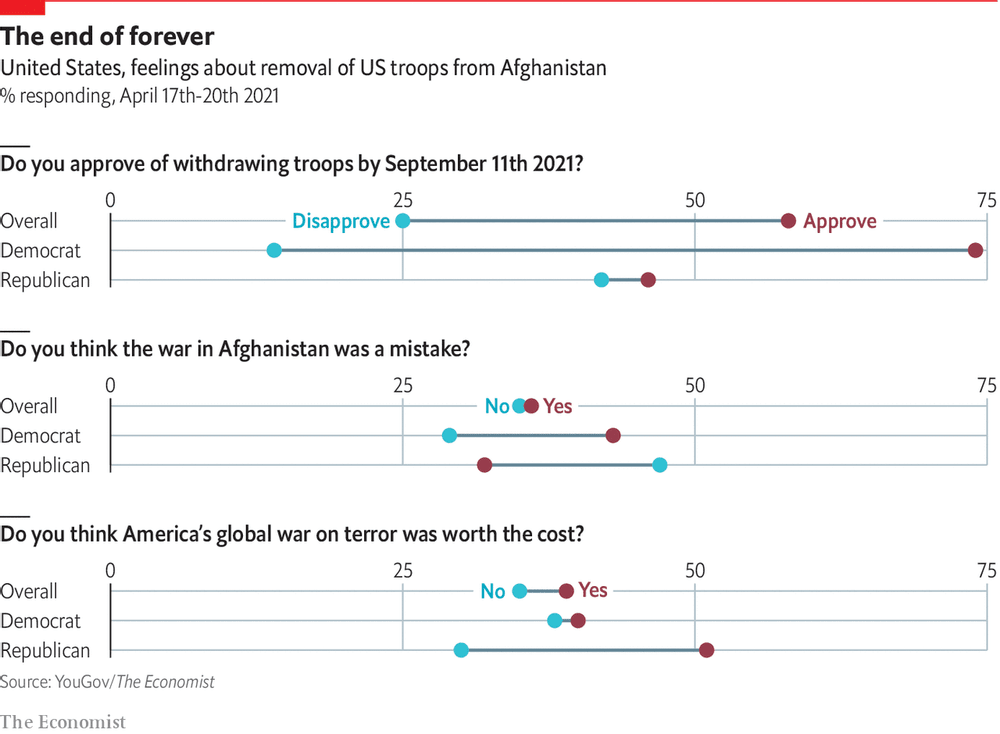
return on effort

Reading this chart won't take as long as withdrawing troops from Afghanistan

Kaiser deciphers a chart showing Americans' response to Biden's decision to withdraw troops from Afghanistan.
Read More
Bloomberg made me digest these graphics slowly
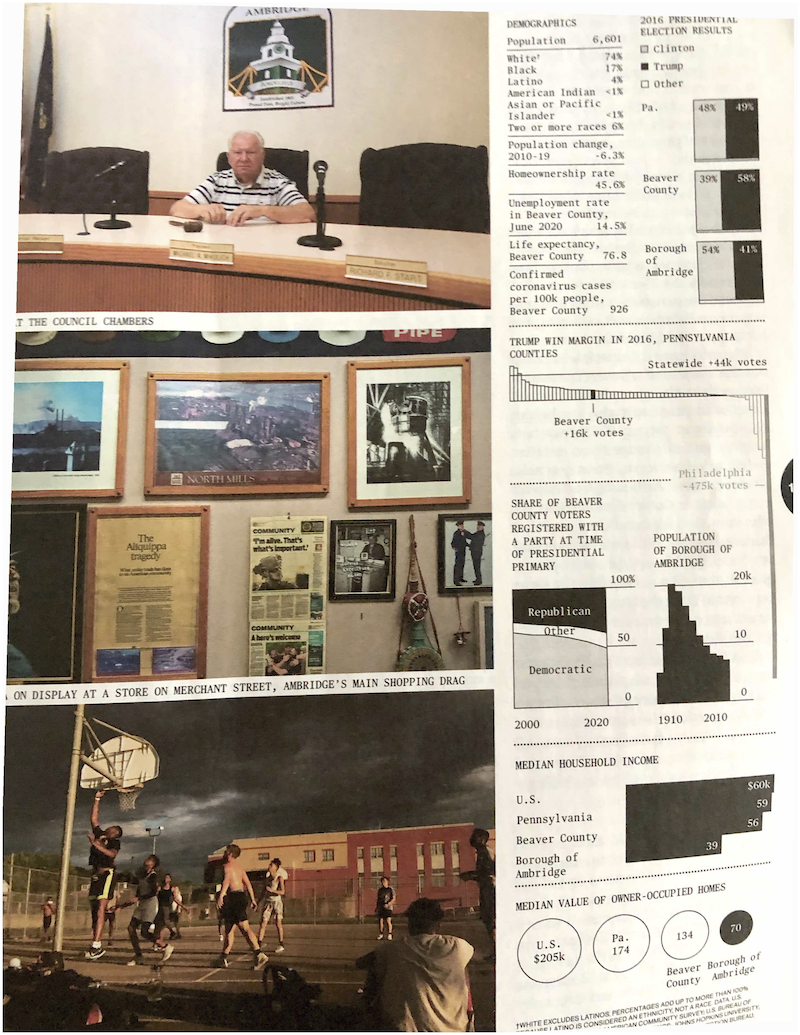
return on effort

Bloomberg made me digest these graphics slowly

Kaiser enjoys reading the graphics in the Businessweek issue on elections.
Read More
Page 1 of 1
Junk Charts © 2025
  • BOOKS
  • COURSES
  • PRESS
  • CONSULTING
  • COACHING
  • CONTACT
Powered by Ghost