Analytics-business interaction Changing metrics when you dislike the results Kaiser reacts to New York Governer's attempt to re-define what counts as a Covid-19 case.
Data What's smelling fishy? Maybe your data Kaiser answers a reader's question about diagnosing data problems.
Bias Further adventures of case-counting windows Kaiser discusses several observations from the Israel booster study.
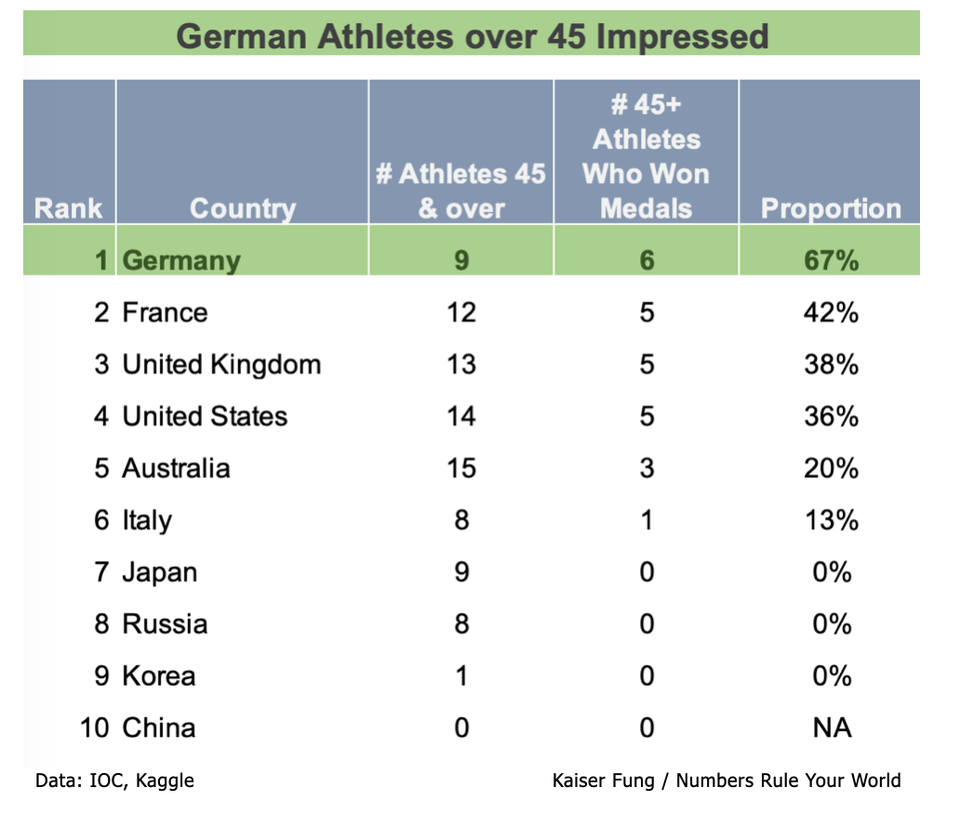
Big Data Round 2: 10 Ways to Rank the Rio Summer Olympics Kaiser finds another set of 10 metrics that can be used to rank any country top of the medals table.
Models Primer on Regression Adjustments 1 Kaiser starts a series of posts about regression adjustments.