Assumptions Great data journalism should have destroyed Djokovic's story but it didn't Kaiser describes some fun data sleuthing work as Germans looked into a tennis superstar's Covid-19 test results.
Aggregation Open questions of the pandemic, part 2 Kaiser continues to discuss open questions of the pandemic, including questions raised by a recent White House graphic.
Analytics-business interaction Changing metrics when you dislike the results Kaiser reacts to New York Governer's attempt to re-define what counts as a Covid-19 case.
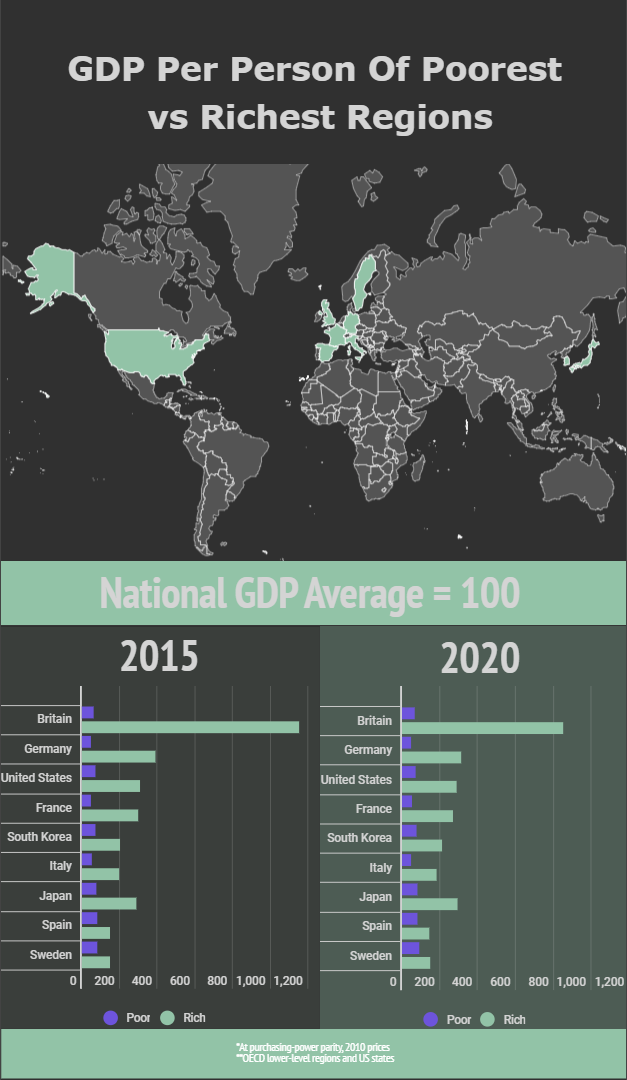
ray vella Displaying convoluted indices Kaiser shows how a small change in structure clarifies comparisons on a data visualization project.
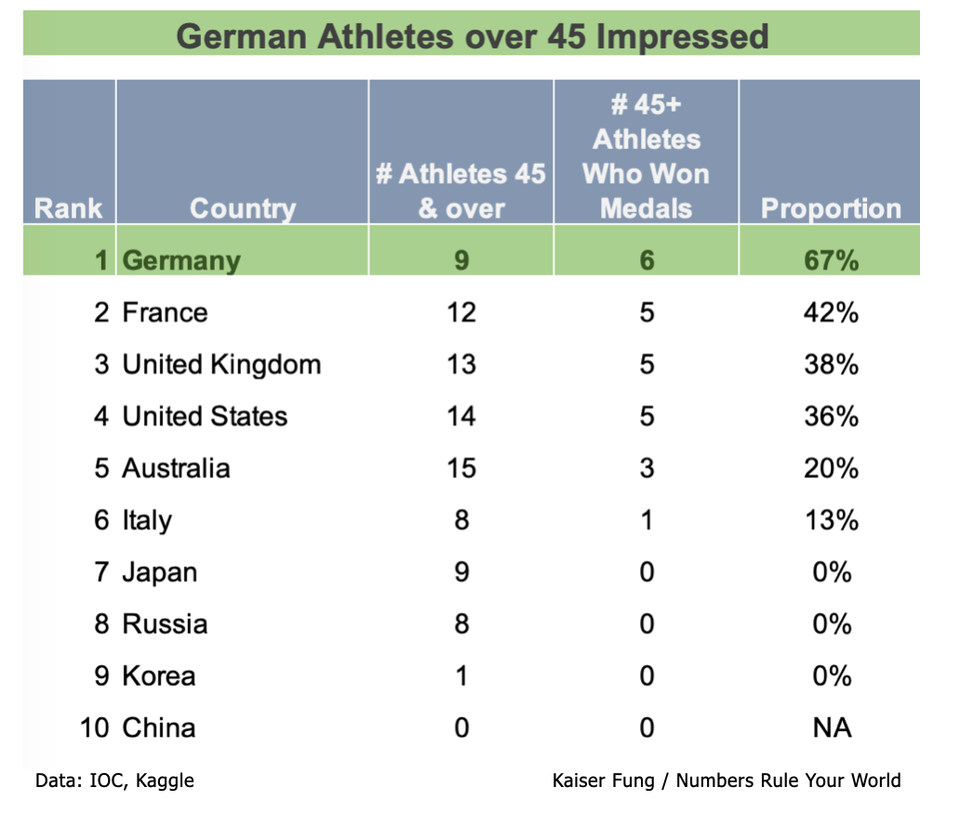
Big Data Round 2: 10 Ways to Rank the Rio Summer Olympics Kaiser finds another set of 10 metrics that can be used to rank any country top of the medals table.
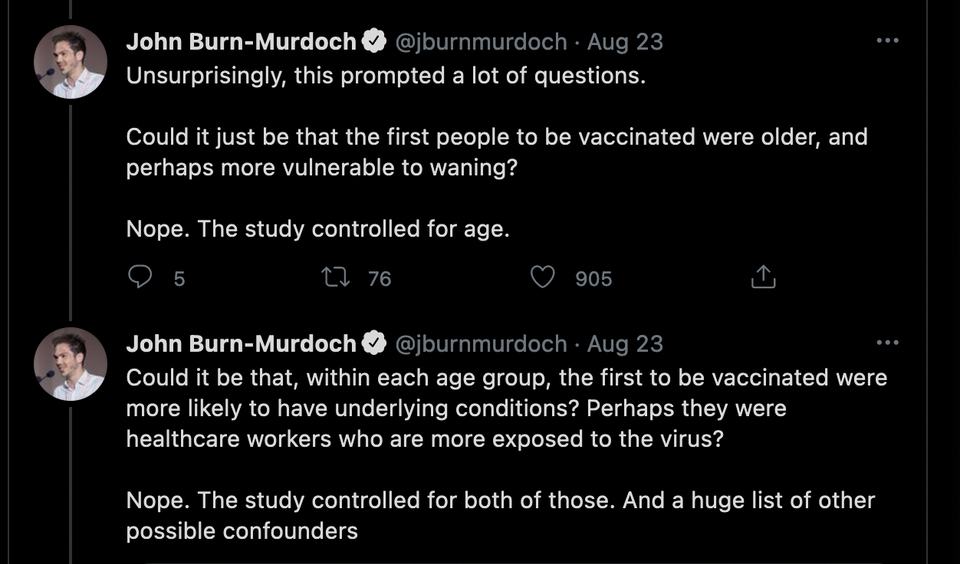
Models Primer on Regression Adjustments 1 Kaiser starts a series of posts about regression adjustments.