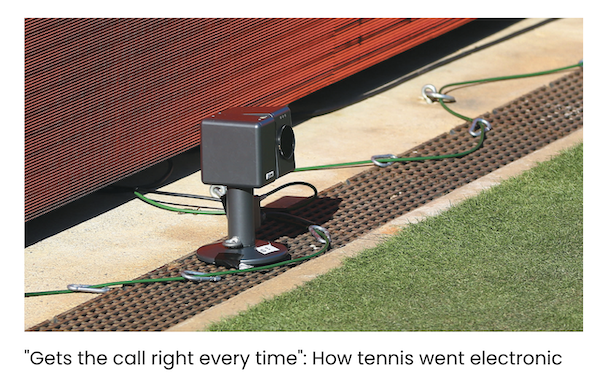
Junk Charts
  • About
  • RSS
  • Posts by Year
  • Posts by Keywords
Sign in Subscribe

Statistics

Illusion of perfection
Data

Illusion of perfection

The illusion of perfection ignores statistical uncertainty
Read More
The reckless practice of eyeballing trend lines
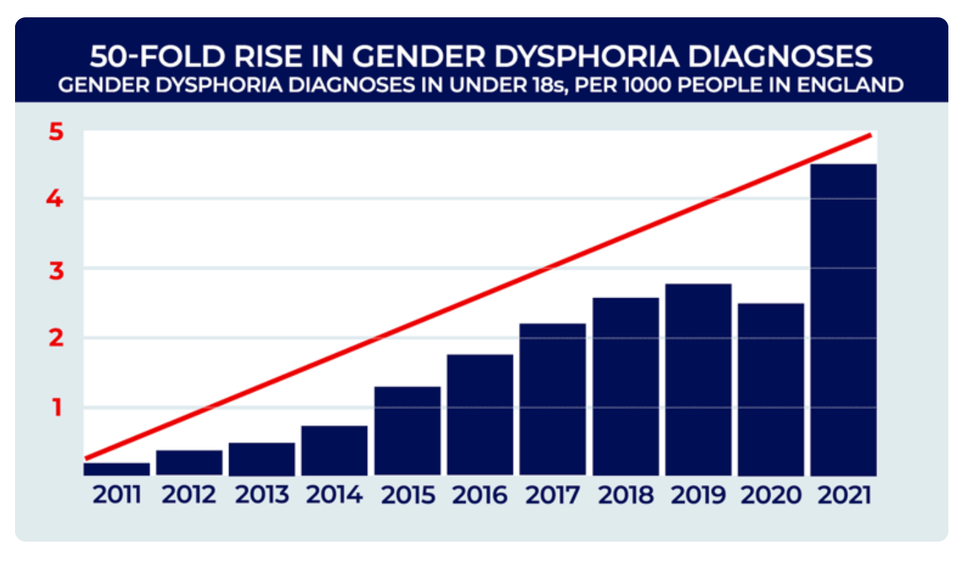
Bar chart

The reckless practice of eyeballing trend lines

The reckless practice of eyeballing trend lines
Read More
Deliberately obstructing chart elements as a plot point
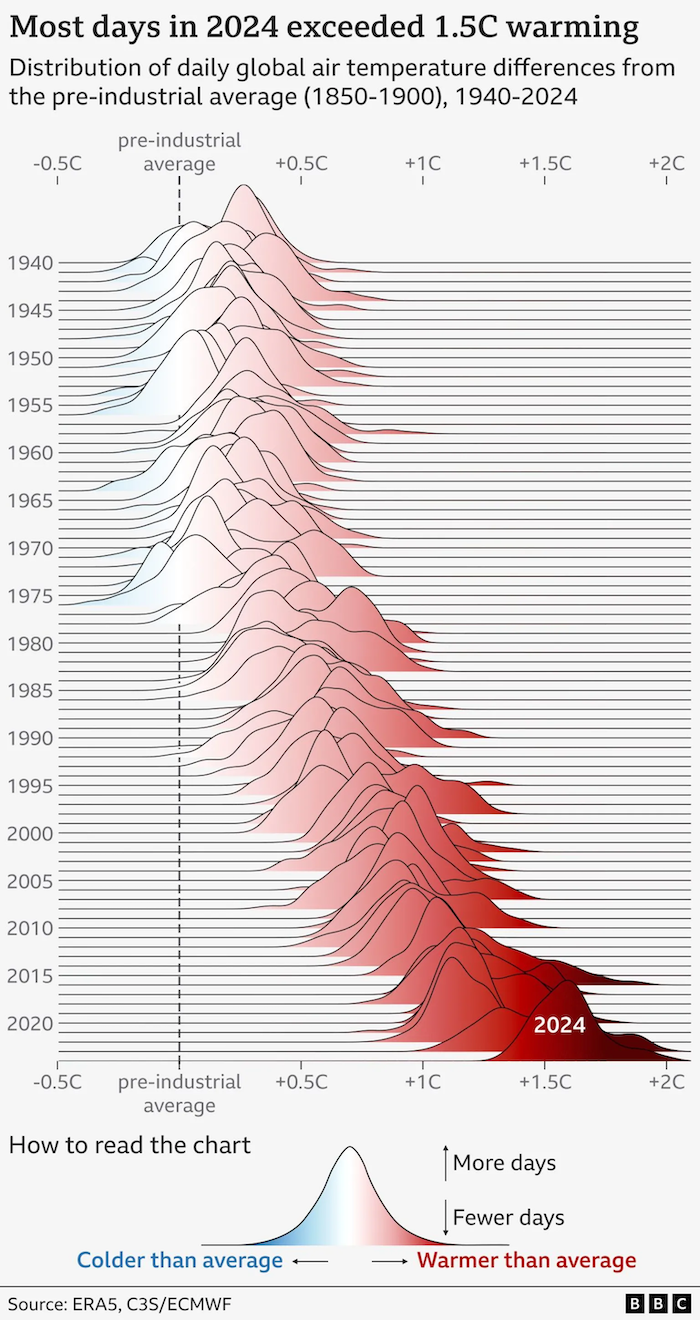
ridge plot

Deliberately obstructing chart elements as a plot point

These "ridge plots" have become quite popular in recent times.
Read More
Two challenging charts showing group distributions
Area chart

Two challenging charts showing group distributions

Two complex charts that show subgroup distributions of data
Read More
The science of counting more people using fewer people
Aggregation

The science of counting more people using fewer people

Trying to count more with less
Read More
How hard can counting be?
Analytics-business interaction

How hard can counting be?

How hard can counting be? Reflections on the jump in homeless in the US
Read More
← Newer Posts Page 3 of 15 Older Posts →
Junk Charts © 2025
  • BOOKS
  • COURSES
  • PRESS
  • CONSULTING
  • COACHING
  • CONTACT
Powered by Ghost