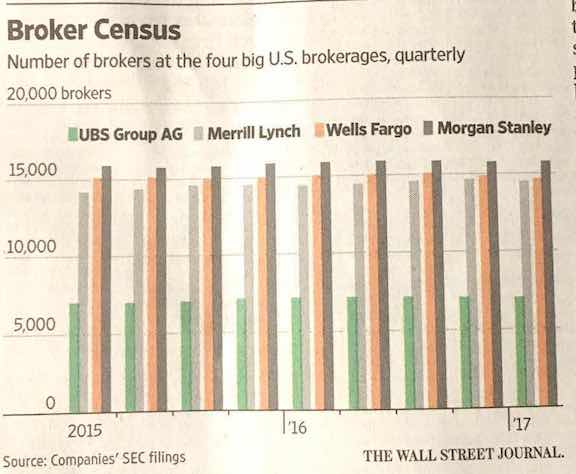
Axis Making people jump over hoops Kaiser Fung, founder of Principal Analytics Prep and Junk Charts, comments on a WSJ chart about how banks pay their brokers
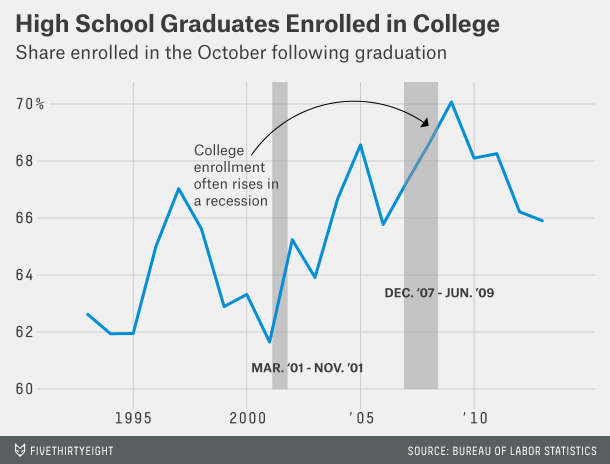
Aggregation It's your fault when you use defaults The following chart showed up on my Twitter feed last week. It&
Comparability Visualizing citation impact Michael Bales and his associates at Cornell are working on a new
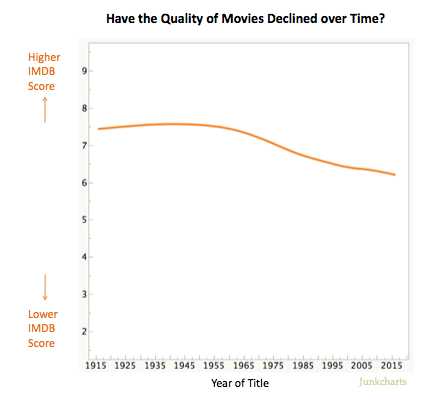
Algorithms Pre-processing data is not just about correcting errors Exploration of IMDB rating data, by Kaiser Fung, founder of Principal Analytics Prep
Aggregation Depicting imbalance, straying from the standard chart My friend Tonny M. sent me a tip to two pretty nice