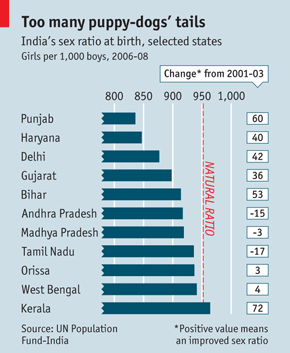
Axis A skewed view of ten Indian states The Economist published this chart to illustrate the problem of the "
Aggregation Bill Gates should hire a statistical advisor My coworker pointed me to a Huffington Post article claiming a Bill
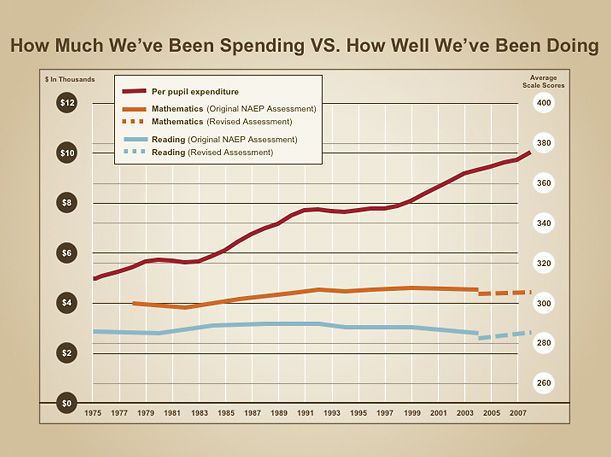
Economics Light entertainment: taxing our mental capacity Reader John M. sent in this brain-teaser of a chart. (Accompanying
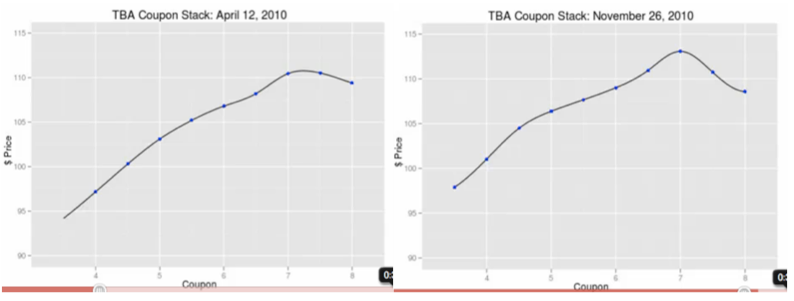
Business A graphlick showing mortgage prices The work of Hans Rosling and Gapminder (now part of Google) highlighted