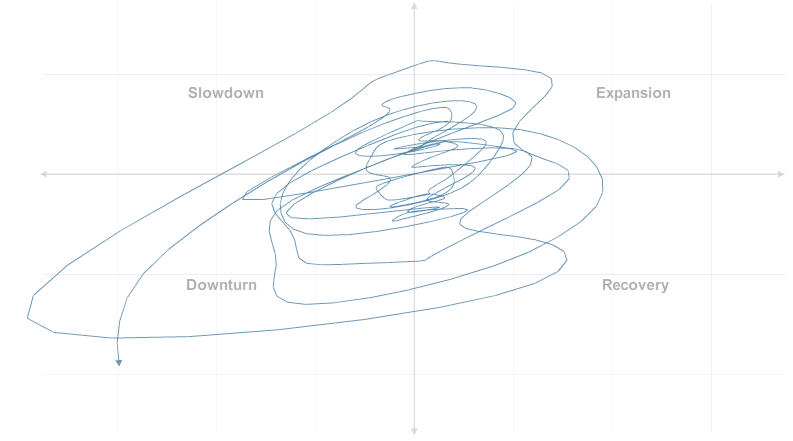
Junk Charts
  • About
  • RSS
  • Posts by Year
  • Posts by Keywords
Sign in Subscribe

Time series

Mind the gap
Business

Mind the gap

When comparing two time series, one typically wants to discuss the size
Read More
How to read a graph
Blogs

How to read a graph

Via Gelman, here is a nifty book-buying map from Amazon, displaying the
Read More
Political theater
Background

Political theater

Jens, a long-time reader, tried to re-make the boring data tables used
Read More
Loss aversion
Aggregation

Loss aversion

Loss aversion manifests itself in chart-making, as it does in economics.  In
Read More
A tale on two charts
Business

A tale on two charts

By now, everyone knows subprime mortgage lenders in the U.S. are
Read More
Proof of rampant U.S. deflation
Blogs

Proof of rampant U.S. deflation

From San Diego Tribune via the Big Picture, irrefutable proof of steady
Read More
← Newer Posts Page 19 of 22 Older Posts →
Junk Charts © 2026
  • BOOKS
  • COURSES
  • PRESS
  • CONSULTING
  • COACHING
  • CONTACT
Powered by Ghost