Junk Charts
  • About
  • RSS
  • Posts by Year
  • Posts by Keywords
Sign in Subscribe

trifecta checkup

Getting metrics right is half the battle
measurement

Getting metrics right is half the battle

Learning from some student projects
Read More
Visualizing hierarchies
sports analytics

Visualizing hierarchies

Bonus: setting gridlines on a circular chart
Read More
Can measure vs should measure
data quality

Can measure vs should measure

Sources of inaccuracy in data
Read More
Scrambled egg
Bar chart

Scrambled egg

Scrambled egg
Read More
On the interpretability of log-scaled charts
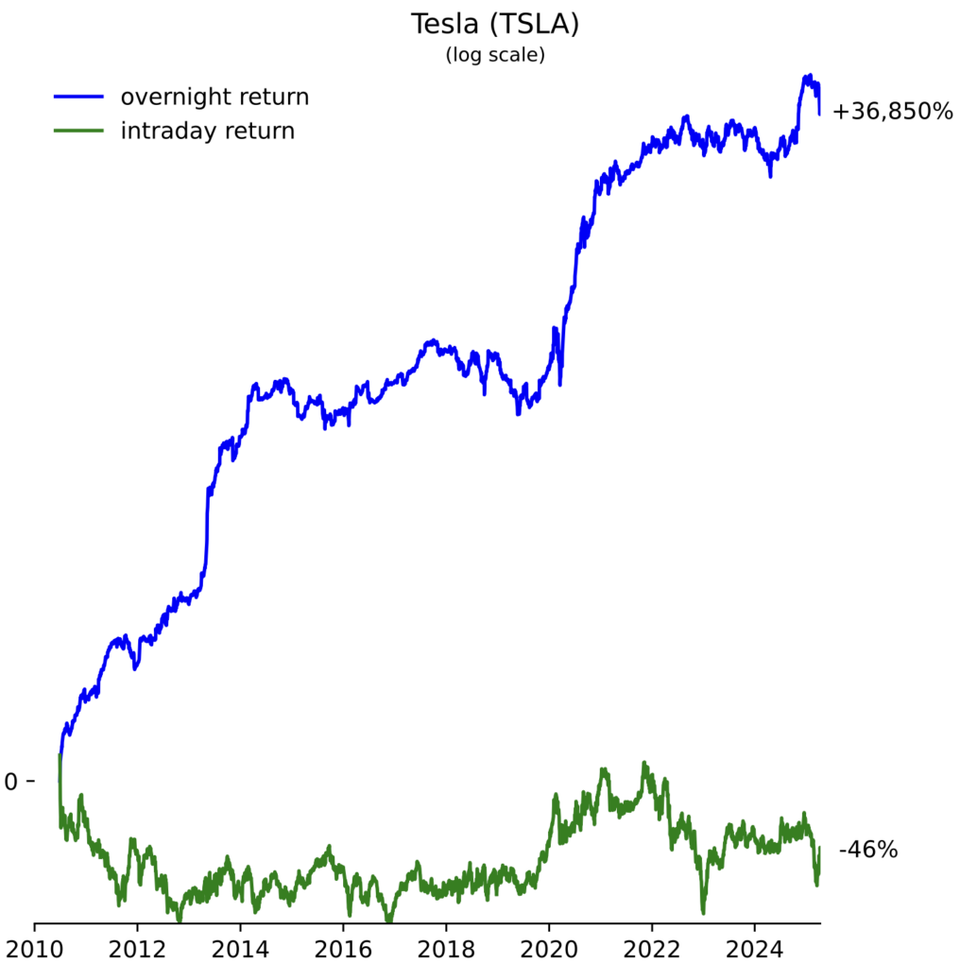
Axis

On the interpretability of log-scaled charts

Are log charts using original value labels more interpretable?
Read More
The message left the visual
Bar chart

The message left the visual

The message ran off the chart
Read More
Page 1 of 5 Older Posts →
Junk Charts © 2026
  • BOOKS
  • COURSES
  • PRESS
  • CONSULTING
  • COACHING
  • CONTACT
Powered by Ghost