Junk Charts
  • About
  • RSS
  • Posts by Year
  • Posts by Keywords
Sign in Subscribe

united kingdom

The reckless practice of eyeballing trend lines
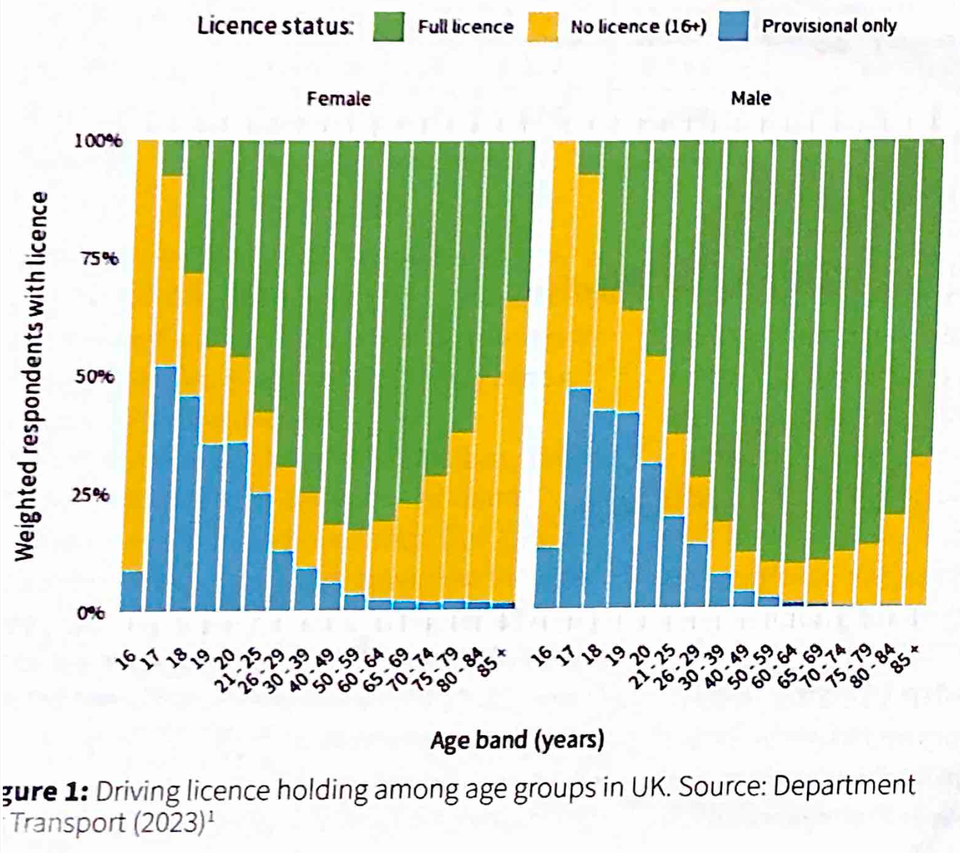
Bar chart

The reckless practice of eyeballing trend lines

The reckless practice of eyeballing trend lines
Read More
Making major things easy, revisited
Dot plot

Making major things easy, revisited

Making important things easier, part 2
Read More
Making major things easy, and minor things hard
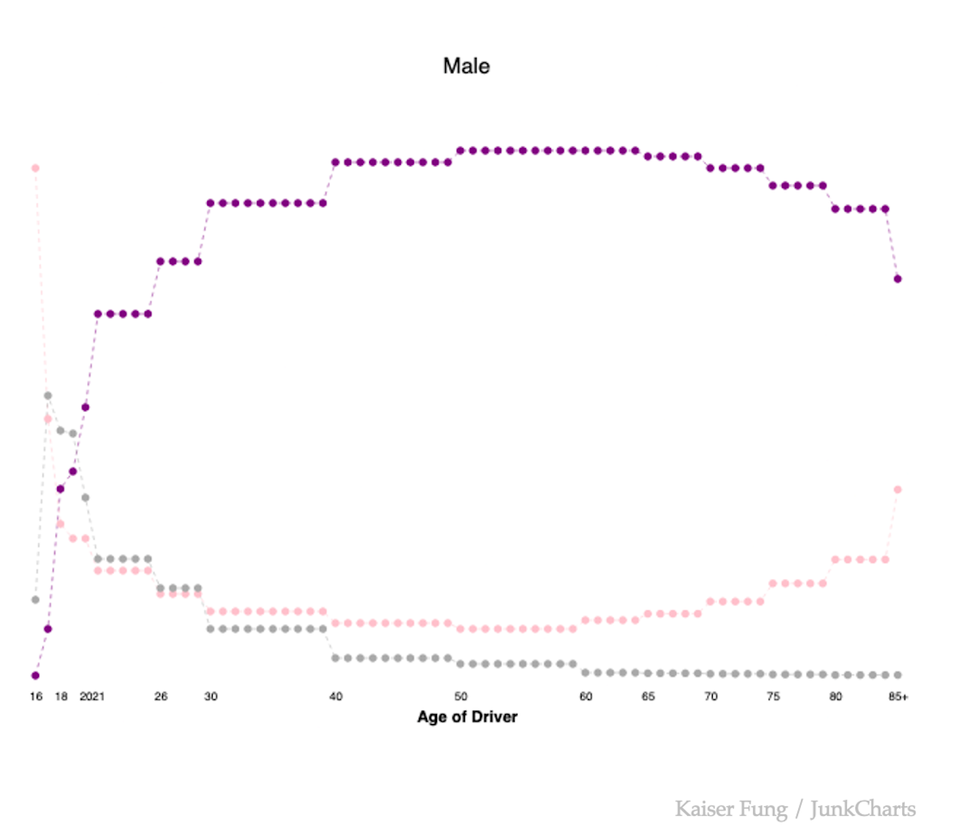
Aggregation

Making major things easy, and minor things hard

Making major things easy, and minor things hard
Read More
Making colors and groups come alive
Bar chart

Making colors and groups come alive

How to use color effectively in a dataviz
Read More
Adjust, and adjust some more
Axis

Adjust, and adjust some more

Kaiser looks at an interactive chart in the Financial Times.
Read More
Excess delay
Bar chart

Excess delay

Kaiser finds a chart that analyzes London's congestion charging programme.
Read More
Page 1 of 3 Older Posts →
Junk Charts © 2026
  • BOOKS
  • COURSES
  • PRESS
  • CONSULTING
  • COACHING
  • CONTACT
Powered by Ghost