Junk Charts
  • About
  • RSS
  • Posts by Year
  • Posts by Keywords
Sign in Subscribe

Variance

The message left the visual
Bar chart

The message left the visual

The message ran off the chart
Read More
Aligning the visual and the message
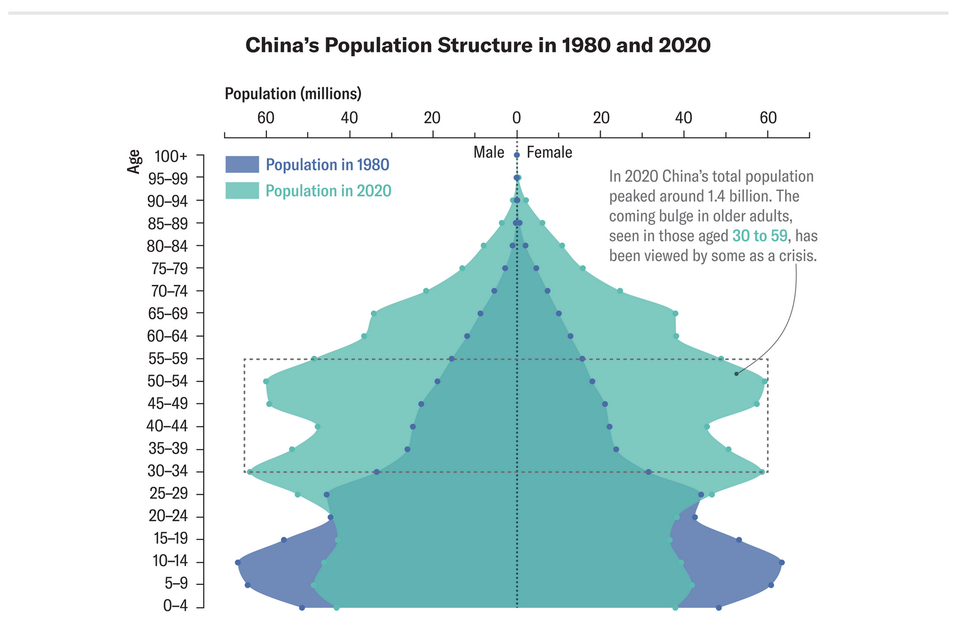
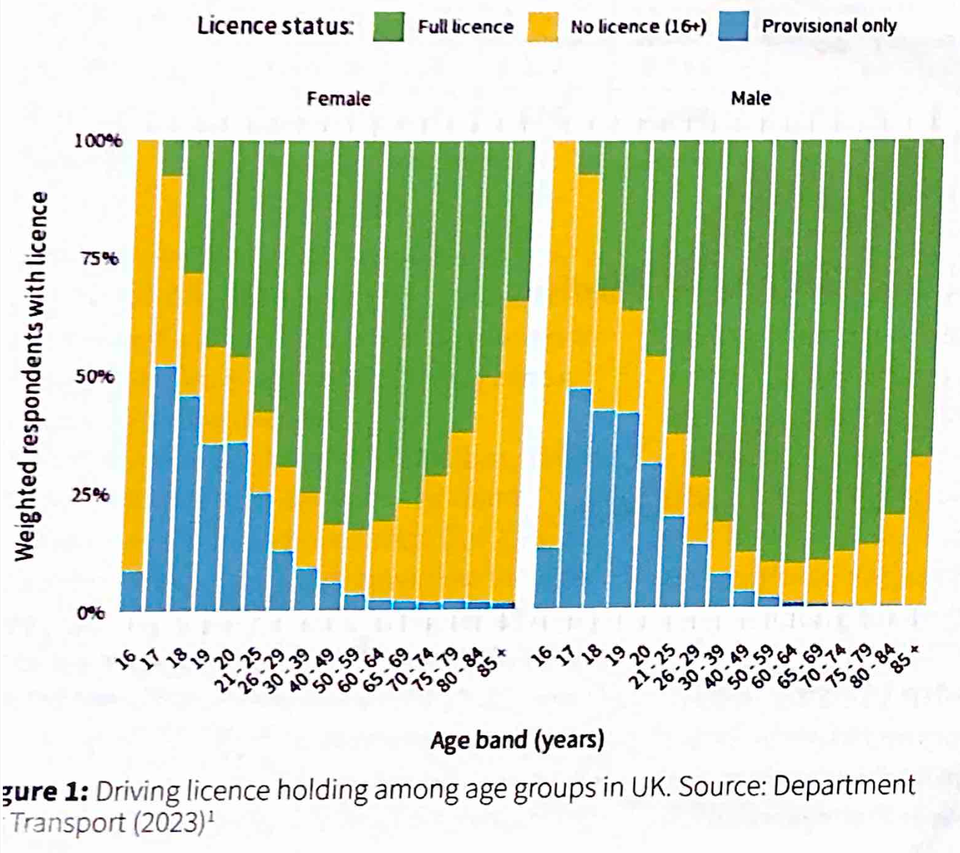
ray vella

Aligning the visual and the message

Student of Ray Vella's NYU class produces a delightful project
Read More
Coffee in different shapes and sizes: a test of self-sufficiency
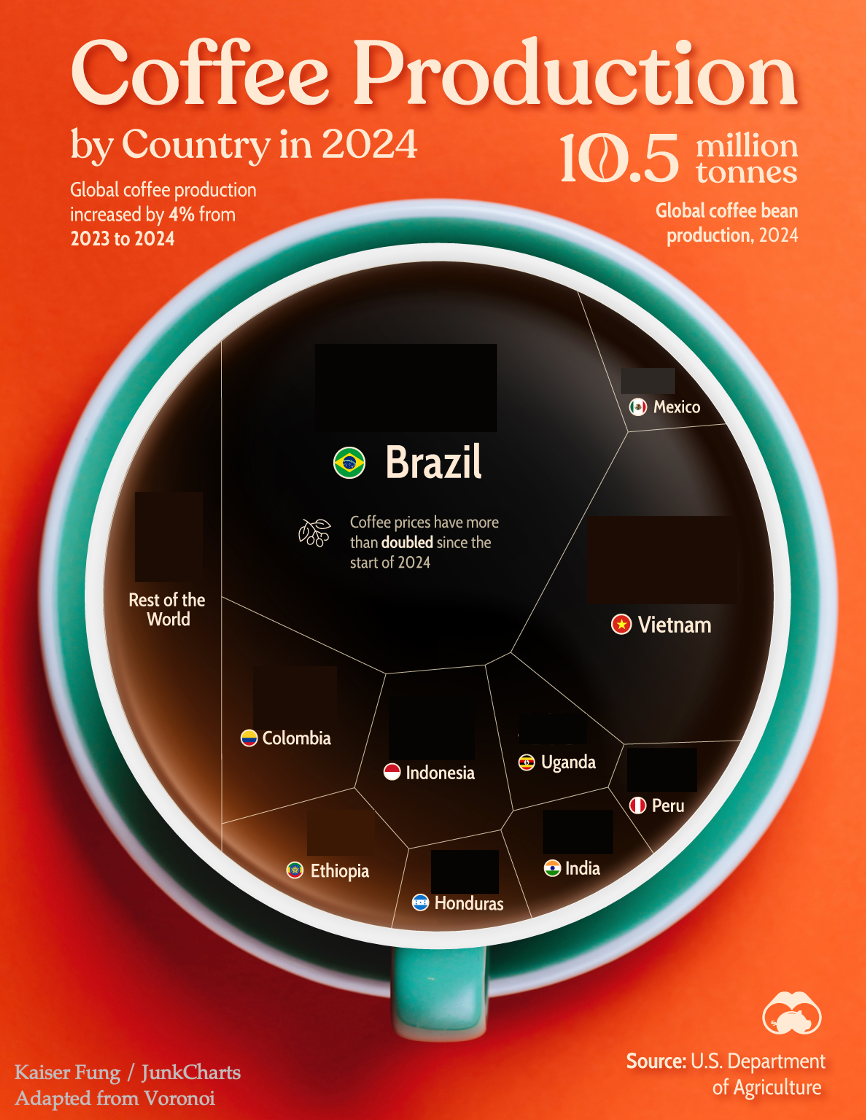
treemap

Coffee in different shapes and sizes: a test of self-sufficiency

You'd need more coffee to read this chart
Read More
Making major things easy, revisited
Dot plot

Making major things easy, revisited

Making important things easier, part 2
Read More
Making major things easy, and minor things hard
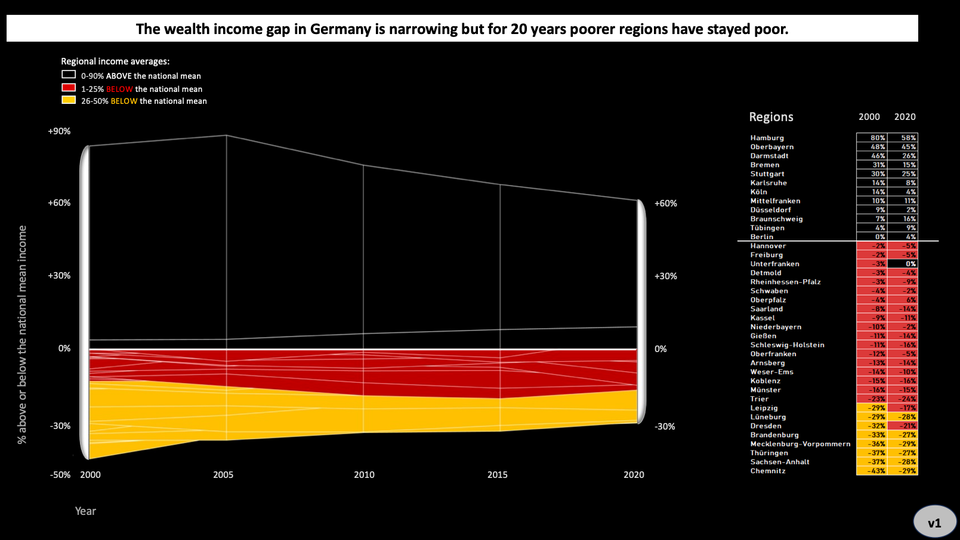
Aggregation

Making major things easy, and minor things hard

Making major things easy, and minor things hard
Read More
Deliberately obstructing chart elements as a plot point
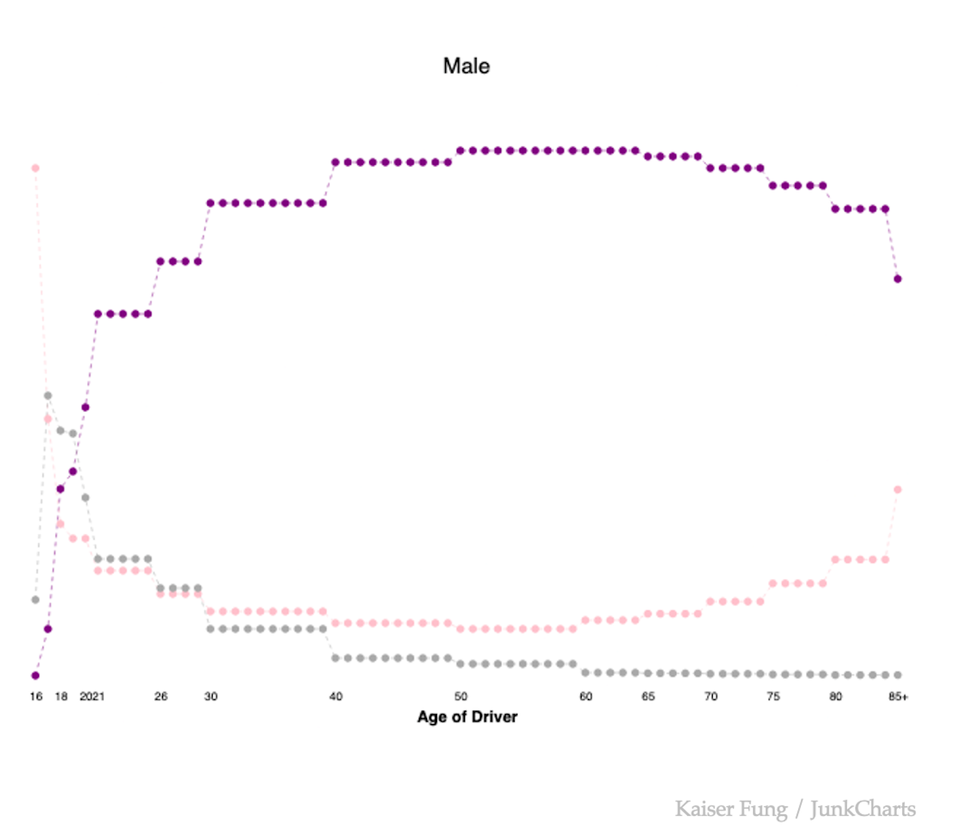
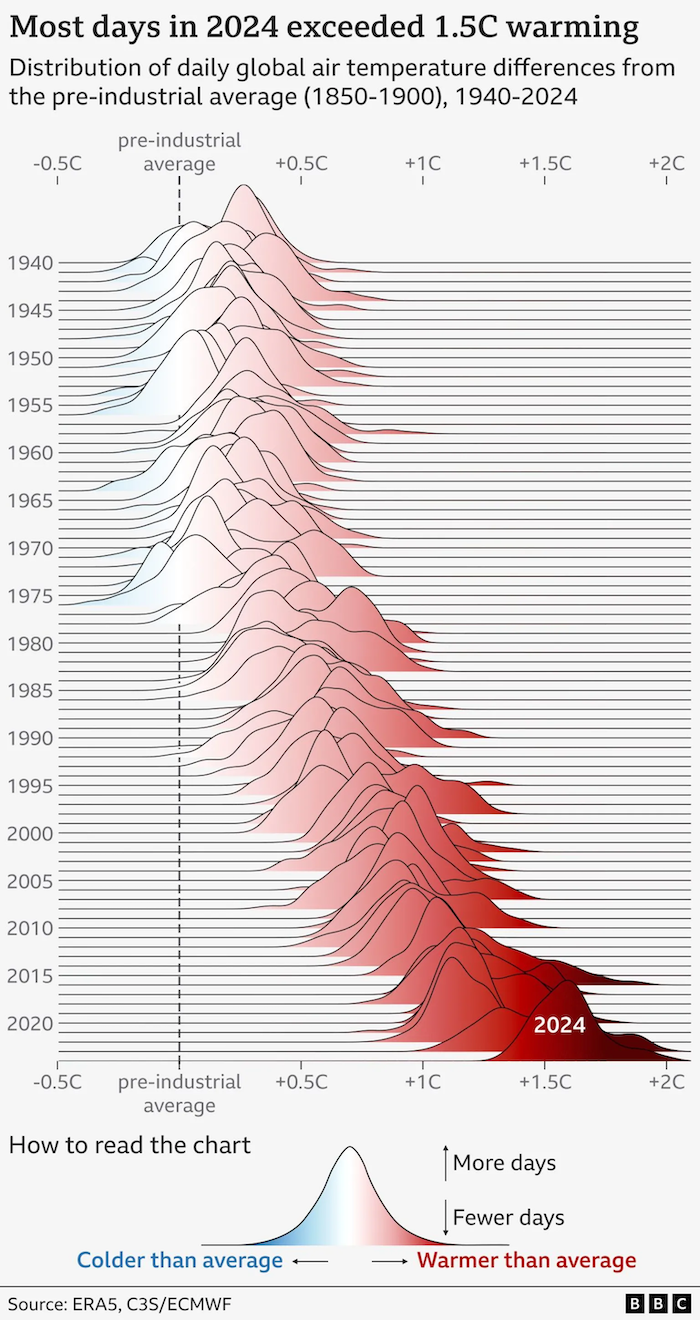
ridge plot

Deliberately obstructing chart elements as a plot point

These "ridge plots" have become quite popular in recent times.
Read More
← Newer Posts Page 2 of 15 Older Posts →
Junk Charts © 2025
  • BOOKS
  • COURSES
  • PRESS
  • CONSULTING
  • COACHING
  • CONTACT
Powered by Ghost