The tweeting crowd
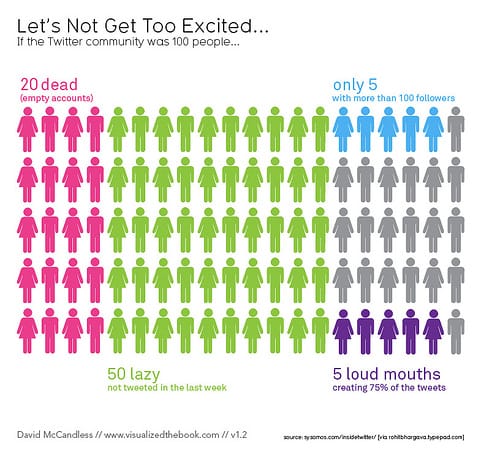
This work by David McCandless, via the Innovations in Newspapers blog, is fantastic.
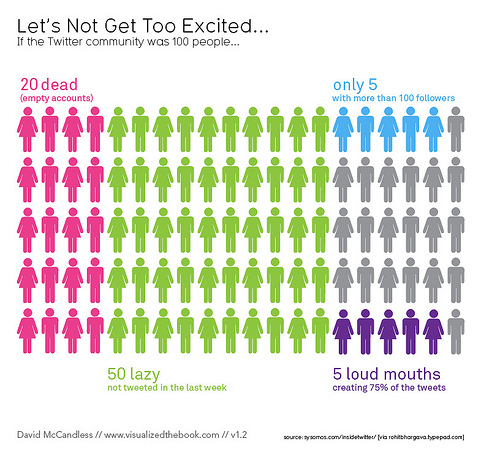
Much of its power comes from the delightful use of short, precise data labels: "20 dead", "50 lazy", "5 loud mouths". And I love the "subjective" title.
A few considerations. The current choice of color, and to some extent the location of subgroups, makes the pinks (dead) and the blues (5% with over 100 followers) stand out. Probably not the intent. The grays are not labeled - not a big deal here since they are not the focus of the chart, and there won't be any short, precise labels for the grays (perhaps the average). Because of the color choice, the grays appeared as if they don't belong.
What might work better is to have darker colors on the right side of the chart, and have the colors fade out towards the left (the lazy and the dead).
Also try a 5x20 grid with five blocks. This allows the height of the chart to represent the relative proportions.
David has recently published a beautiful-looking book, only available in the UK currently. An older book

- on visualizing trivia - is available in the US. He has done work for the Guardian and Wired.


