Transparent circles
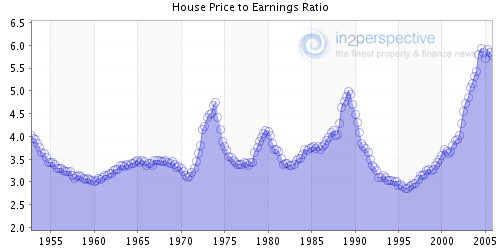

Jens from Library House sent us this chart featuring house price to earnings ratios. In his own words:
"the key thing that I just love is that they have included the data points, but not as points, but as little transparent circles. This allows you to understand by how much two data points are spaced apart from each other, visualising growth and making this chart look very dynamic. I have never seen this in this form before: very nice. Beyond this, the axes are clearly labelled, all in all a very simple chart, beautifully executed."


