Where are the crimes?
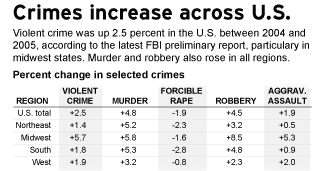

The author of this data table and the readers are asking the same question, "Where are the crimes?", but for different reasons.
While the author wanted to convey regional differences in crime growth, as readers, we are not sure which part of the table to look at; every cell is given equal "weight".

Judging from this "profile plot", we can conclude:
- the Mid-West (blue line) experienced a crime spurt that is very much worse than the national average (dots) in all categories except forcible rapes and murder
- the West (red line), in general, had crime increases less severe than the national average
- that said, the regional profiles are relatively similar, showing few meaningful regional differences (compared to other profile plots I've seen)
Reference: "Communities Grapple With Rise in Violence", MSNBC.com
Thanks to Maya for sending in the link.


