Putting the ladder of abstraction into practice
Explaining complexity one piece at a time

In a previous post, I mentioned Gelman's advice to use the ladder of abstraction to explain complex charts (link).
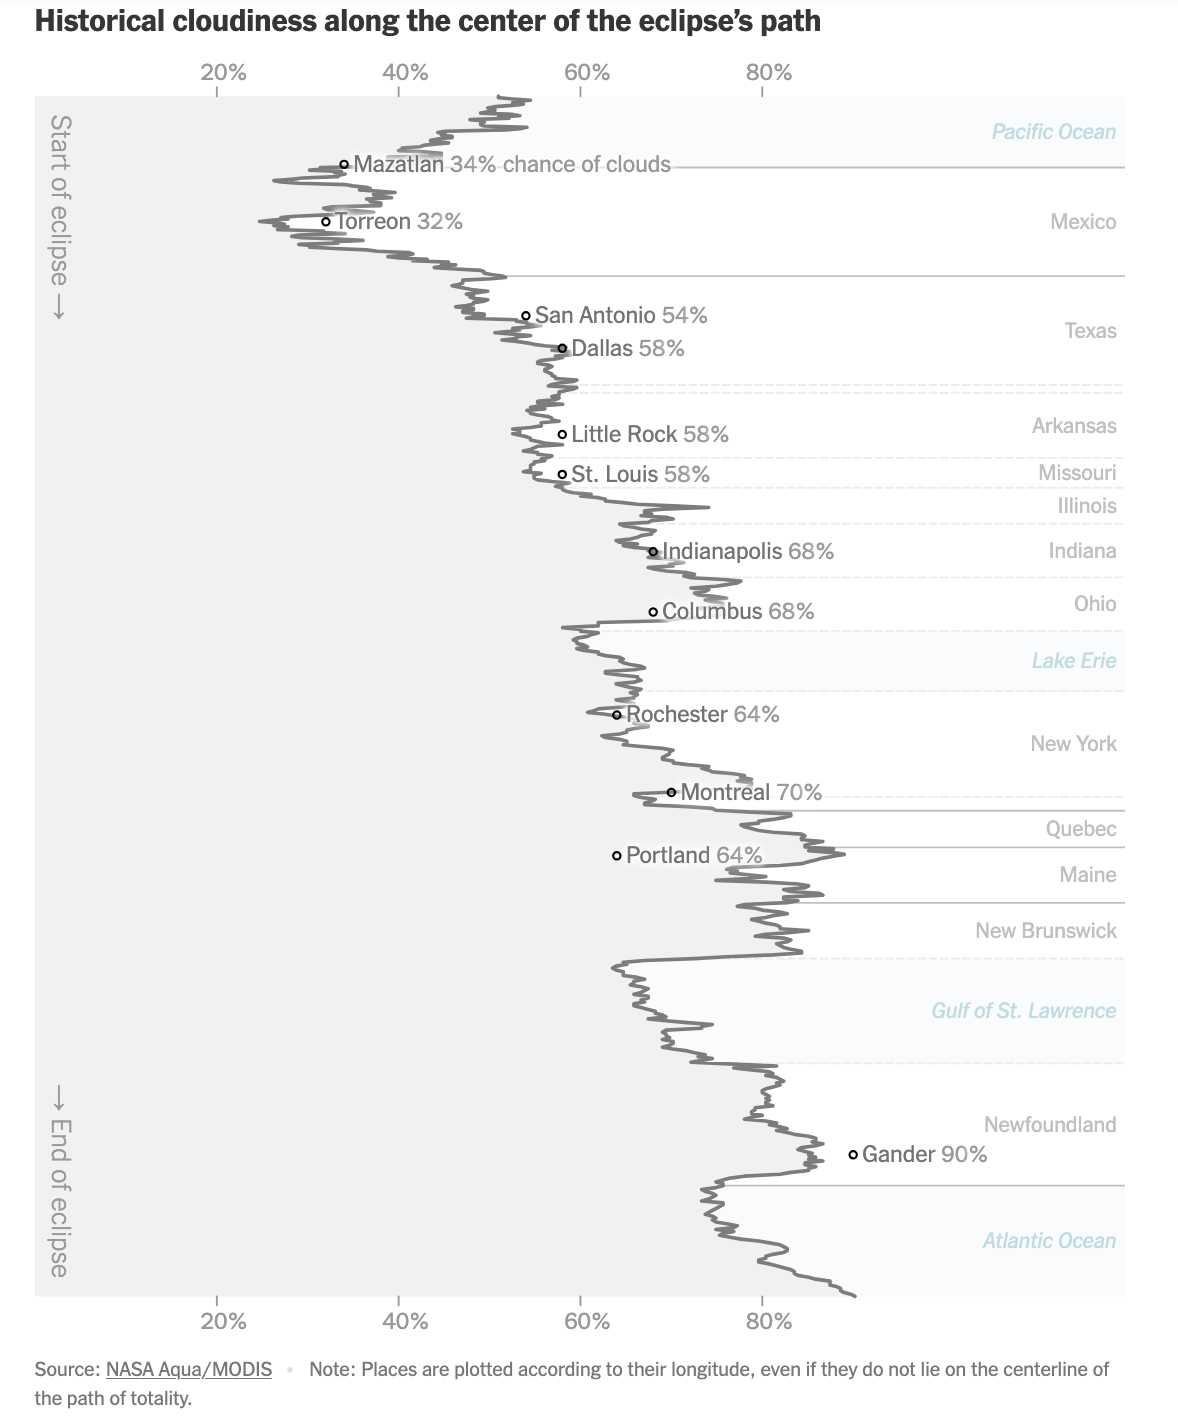
The complex chart is this New York Times's graphic showing the cloud cover at different locations along the path of totality during 2024's full solar eclipse.
Using this example, I drafted how one can construct a series of charts that build up to this line chart.
Start with the least abstract graphic that stays closest to the human experience of our world:
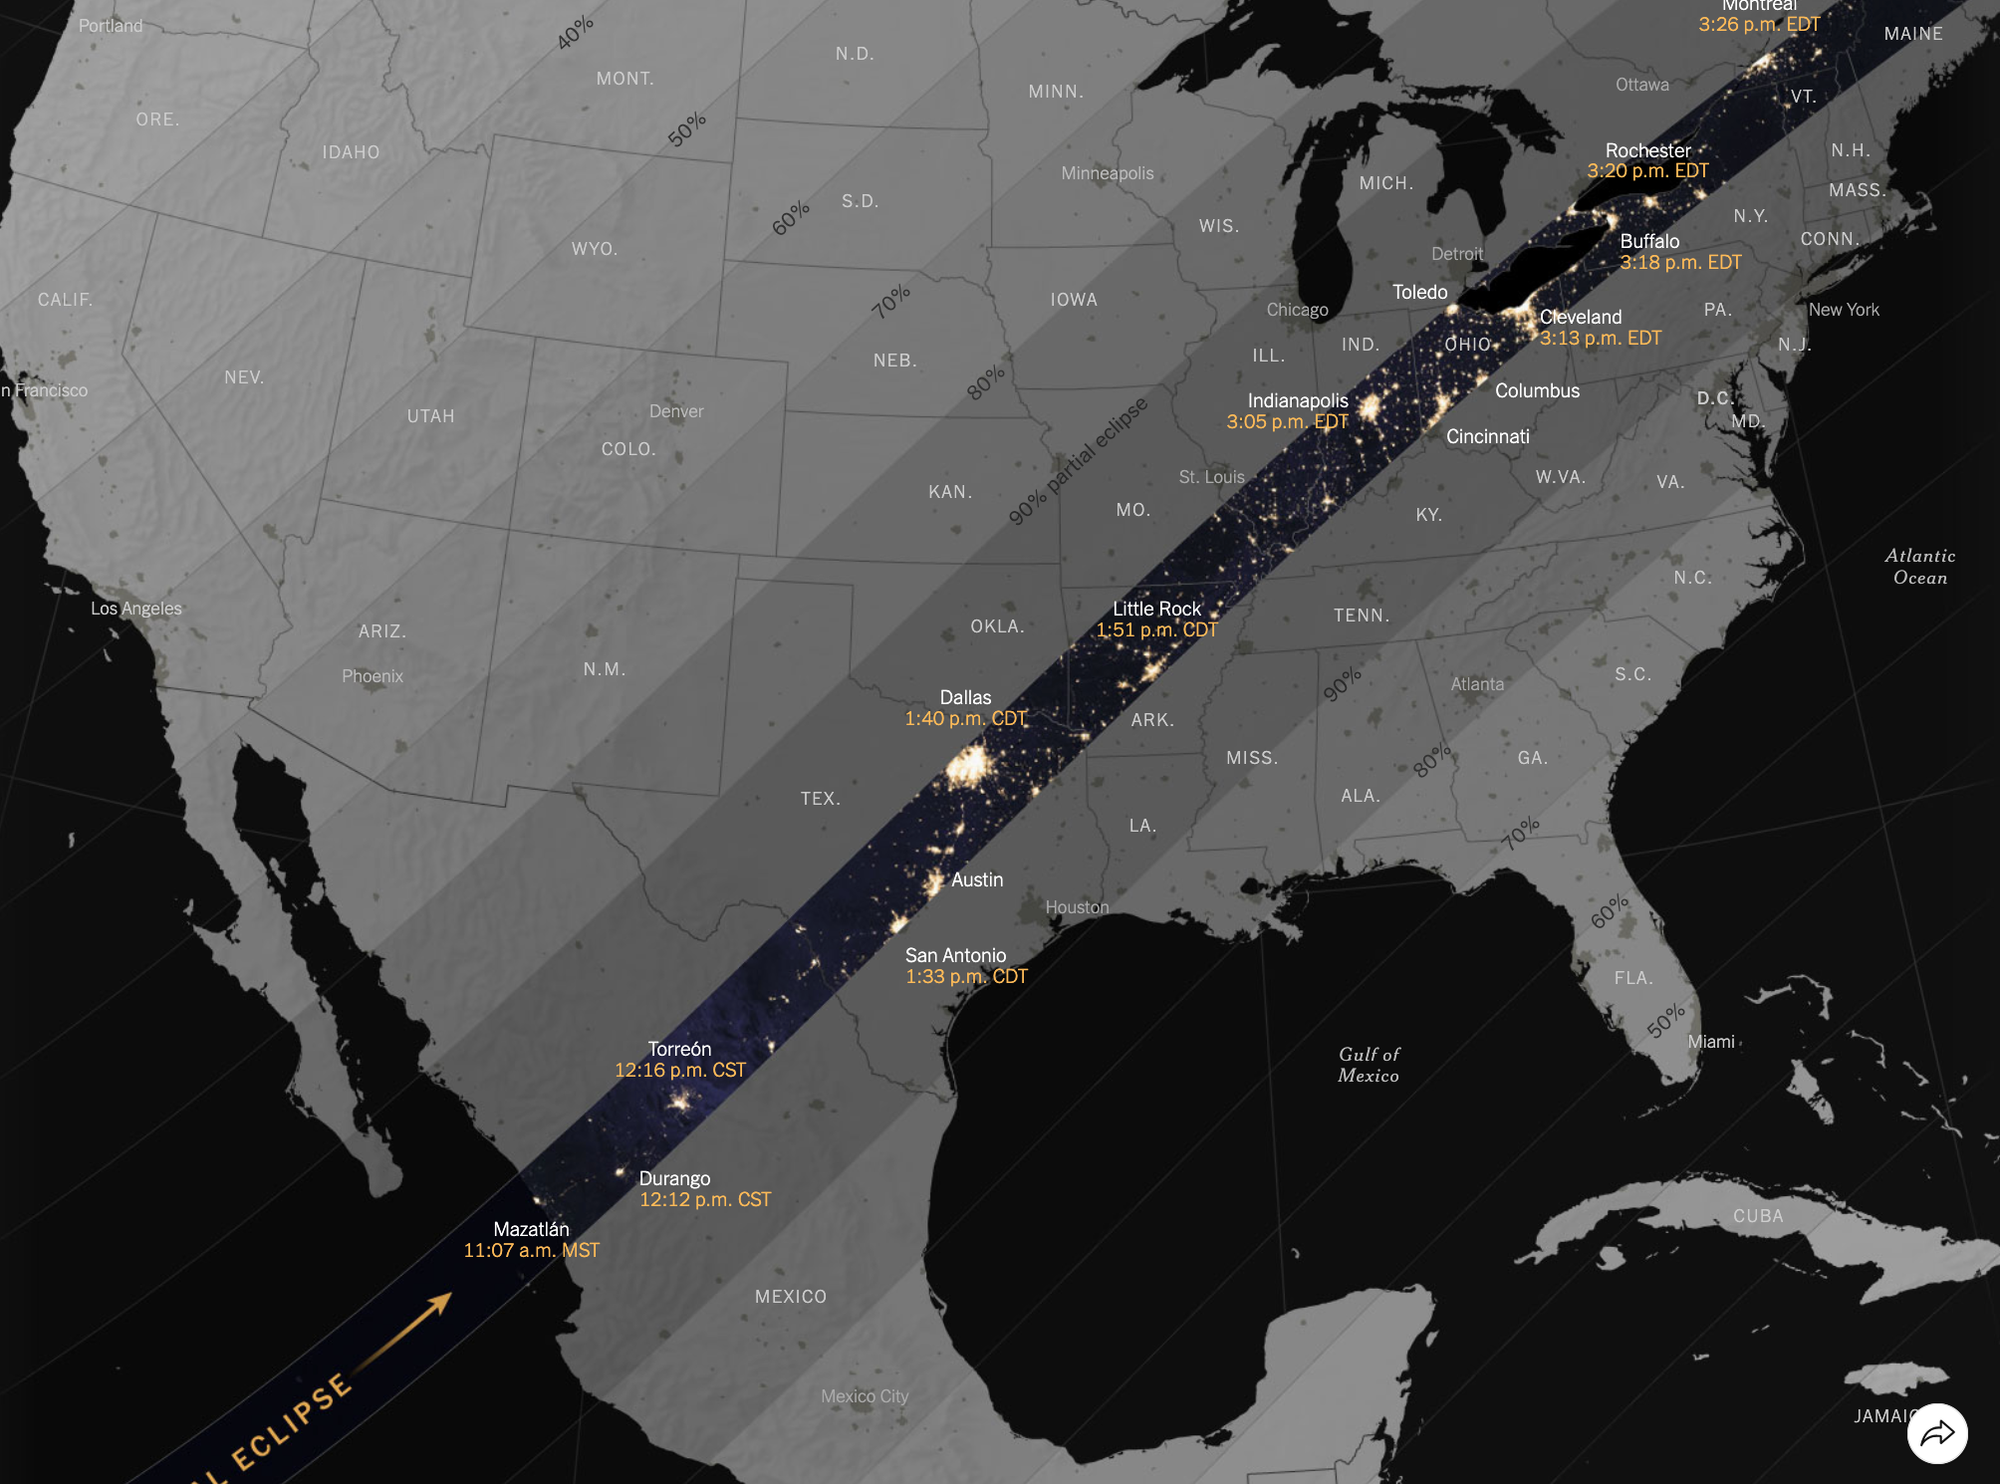
Our sense of space is tied up in maps, even though maps are also abstractions, subject to the specific distortions of the chosen projection scheme. This map presents the background story of the moon's shadow sweeping along the path of totality from the bottom left to the top right of the map.
At the same time, the map also foreshadows which parts of the map are less relevant to the topic at hand. This prepares the readers for when I drill down to specific locations in forthcoming graphics.
The map also couples space and time. Time is provided in data labels at specific locations. Time increments as one moves along the path of totality.
Next, I pick a specific location (Rochester, NY) to demonstrate how an entire experience is reduced to a point in time.
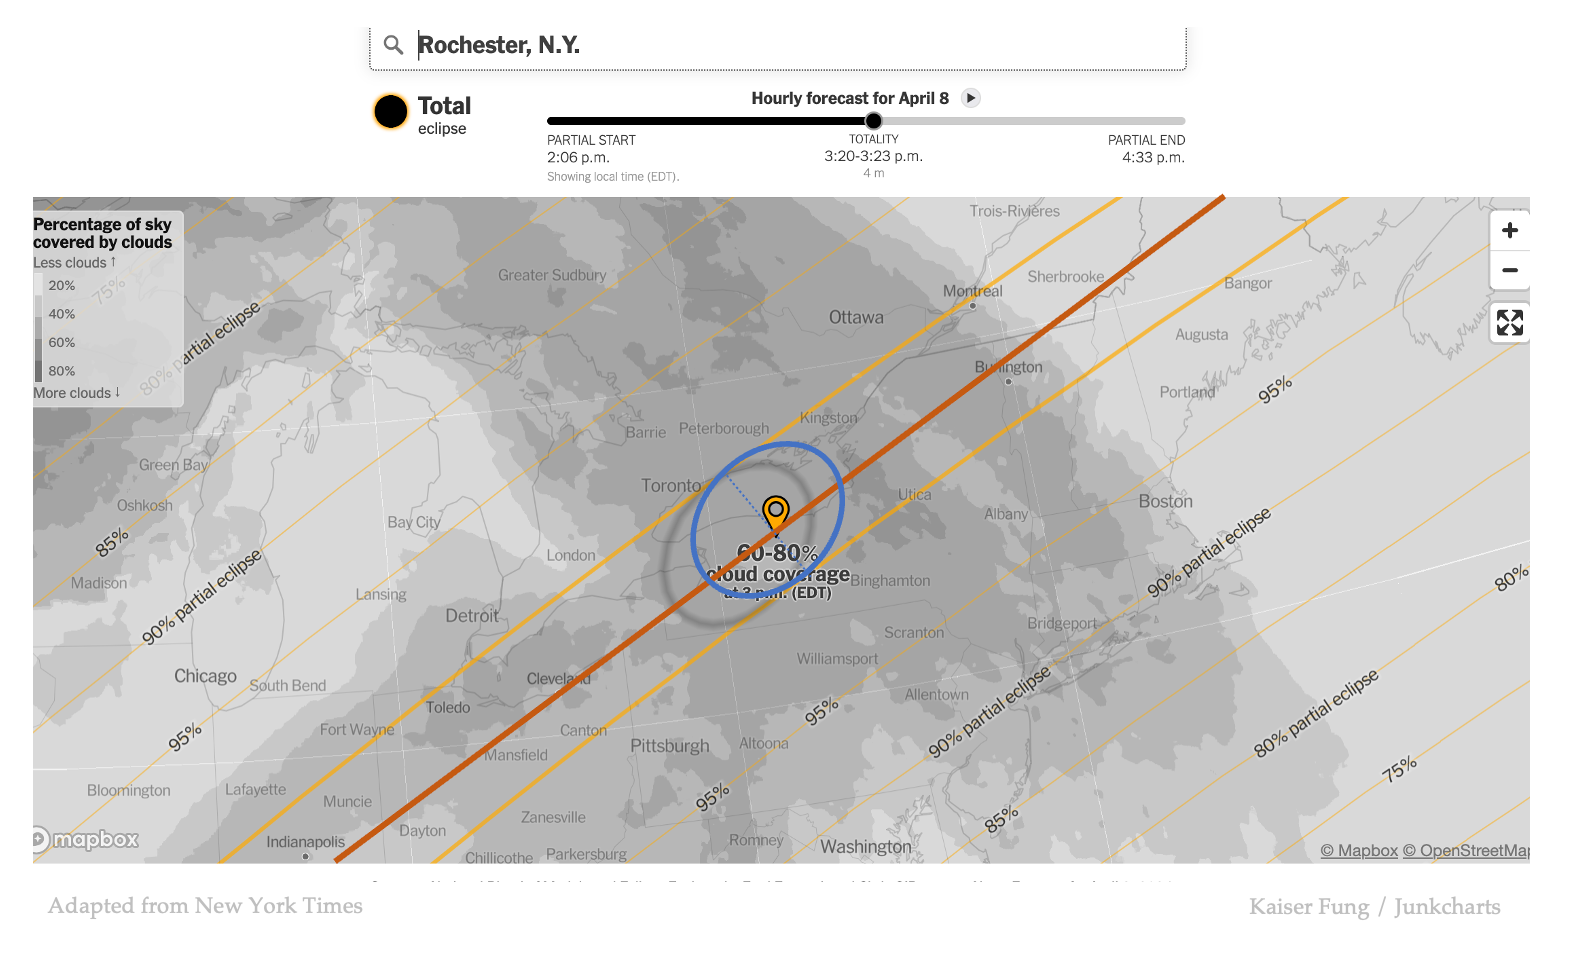
We focus our attention only on the center of the path of totality, as depicted by the added red line. Recall that in the interactive map in the original New York Times's article, the designer lets the reader play with the top slider bar to control the moon's shadow as it moves through time and space.
Here, I nail the moon's shadow to the middle of the observation period, presumably the best time for viewing. This graphic explains how each location will eventually become a single point, which corresponds to a geographical location and a point in time.
In the above map, I'd have left out the cloud cover data, holding them for later.
Then, I make use of the historical cloud cover map to introduce the new variable of visibility.
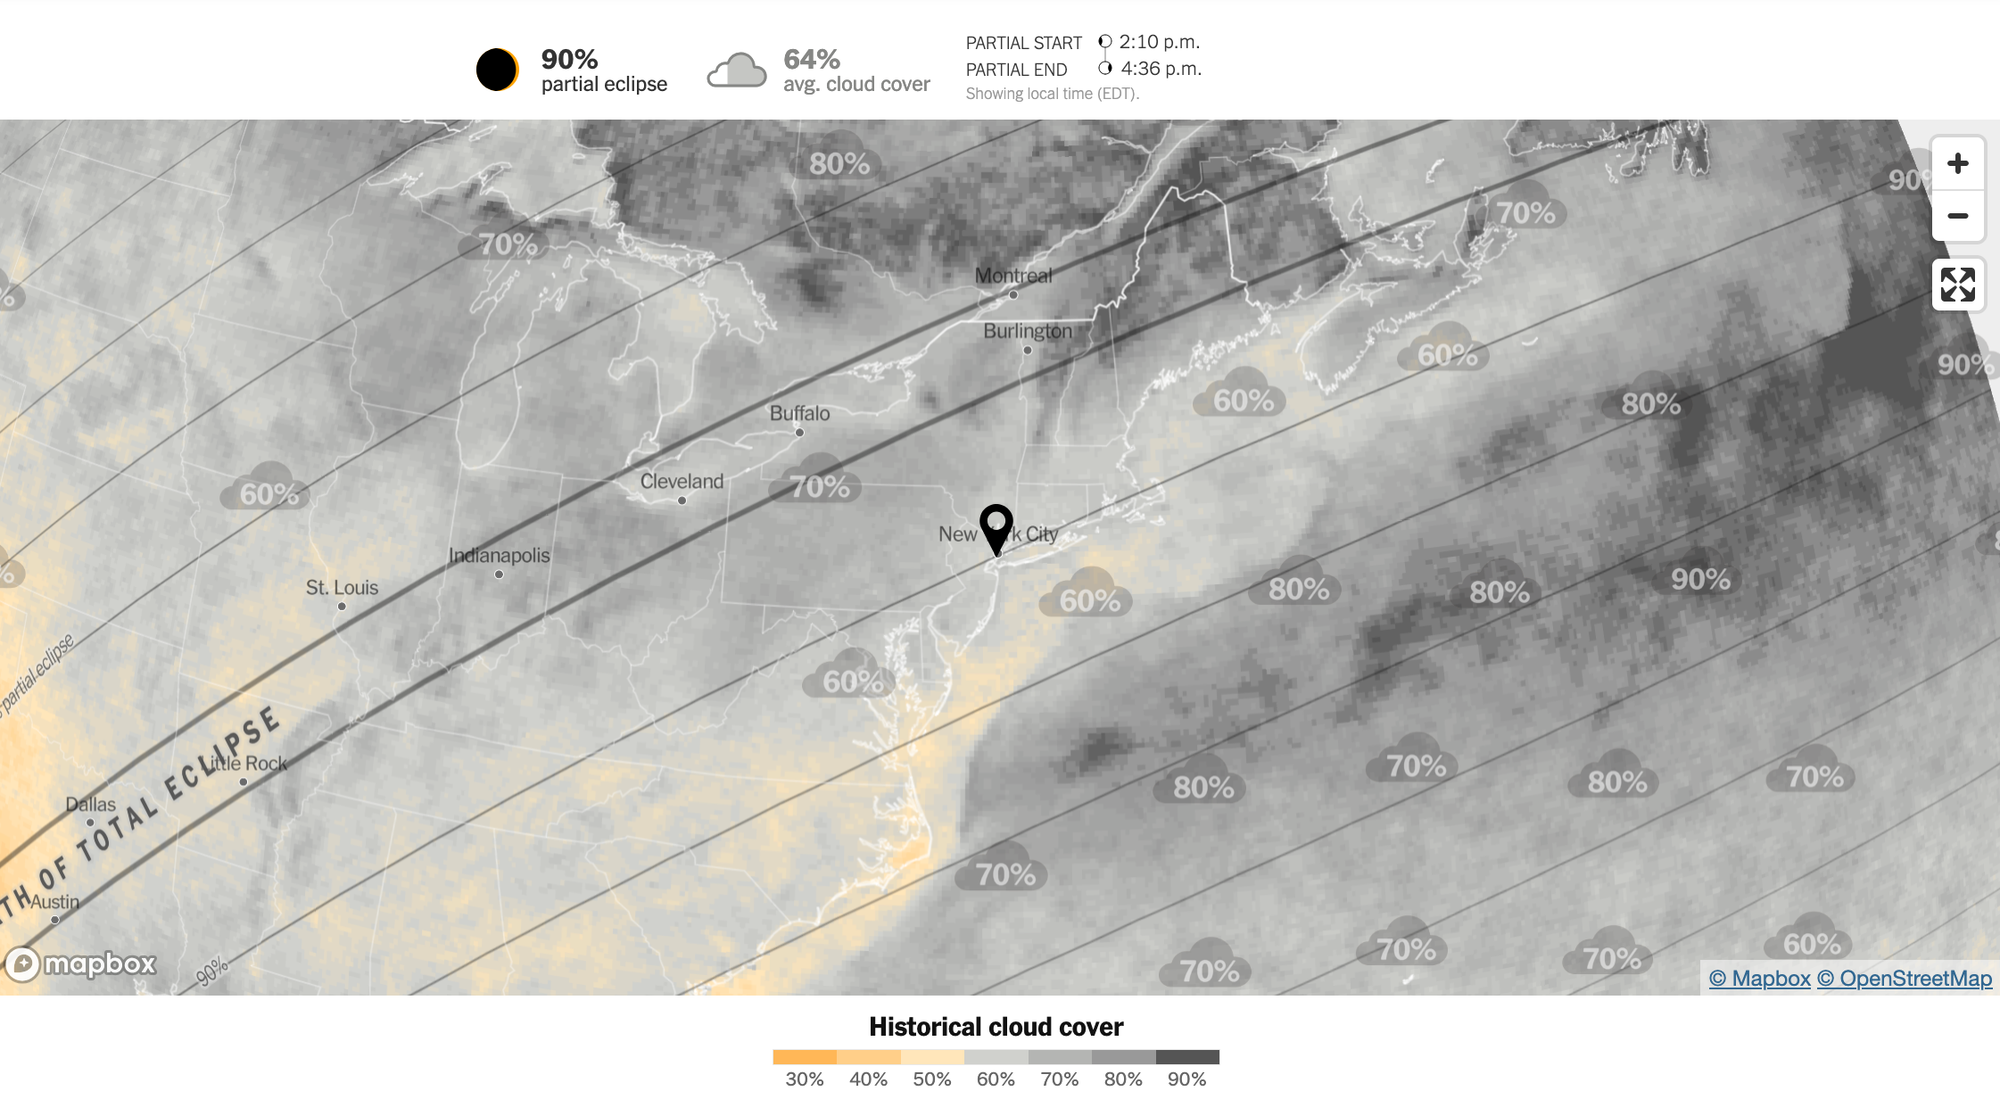
A key takeaway is the color legend, with yellow indicating better visibility. I shall reuse this color scheme.
As a next step, I prepare readers for the shift from maps to a line chart. This step significantly ratchets up the abstraction.
I reduce the above map to a line chart for Rochester.
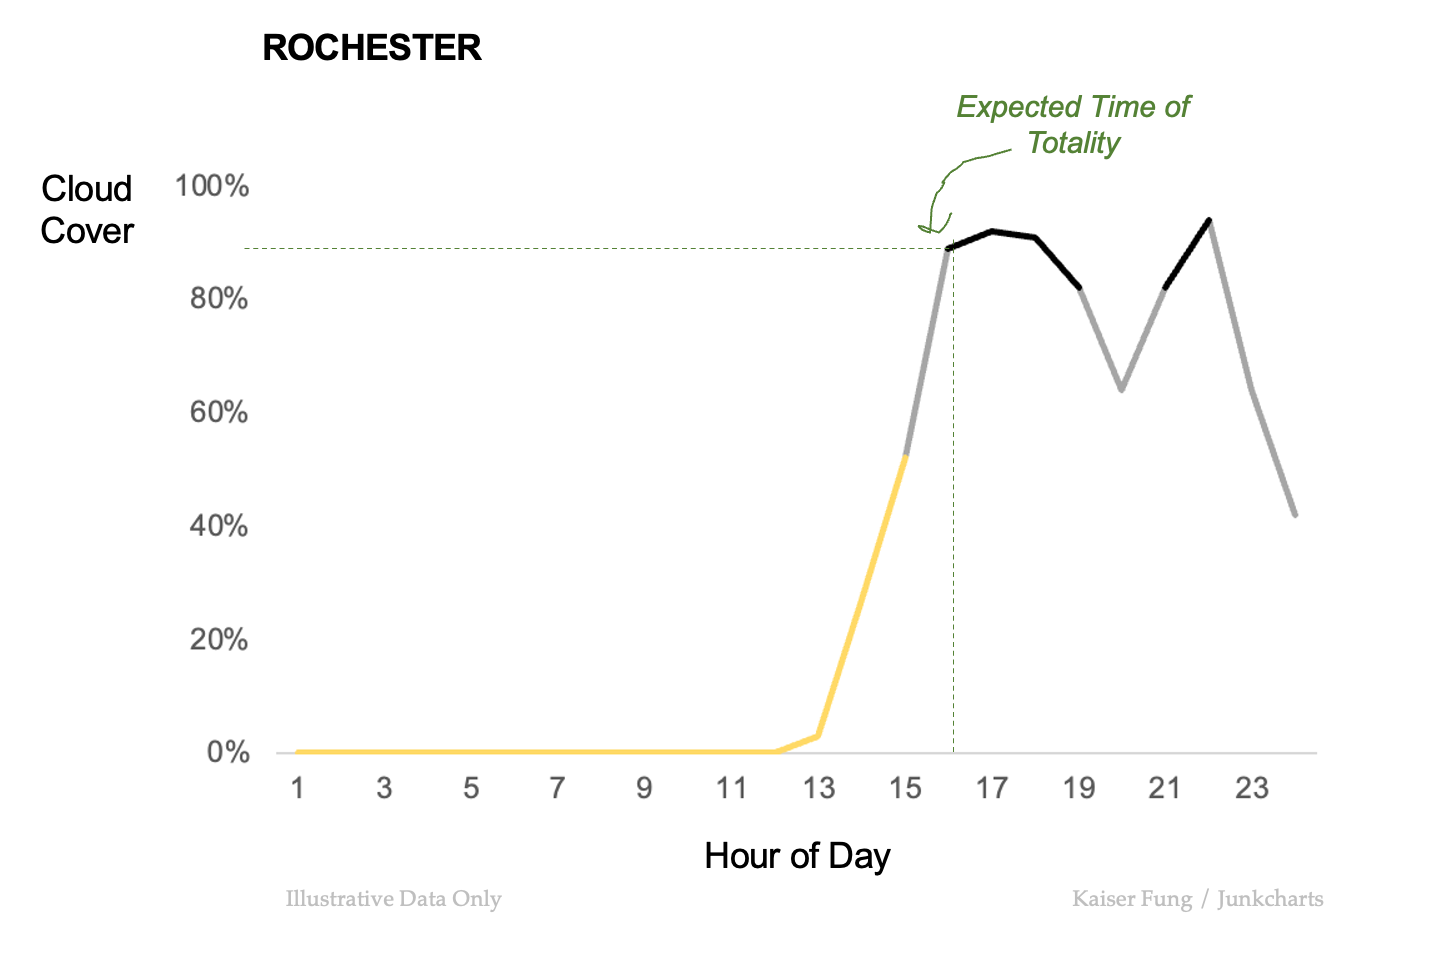
The color scheme is retained (not quite, as I made 3 not 7 levels of color but you get the drift).
The previously developed idea of looking only at the expected time of totality is repeated to focus attention to a single point on this line chart. This sets the reader up to recognize that Rochester will soon feature as a single dot in our final chart.
Lastly, we arrive at the final graphic, which is the New York Times's line chart – with an added flourish of yellow inspired by that historical cloud cover map.
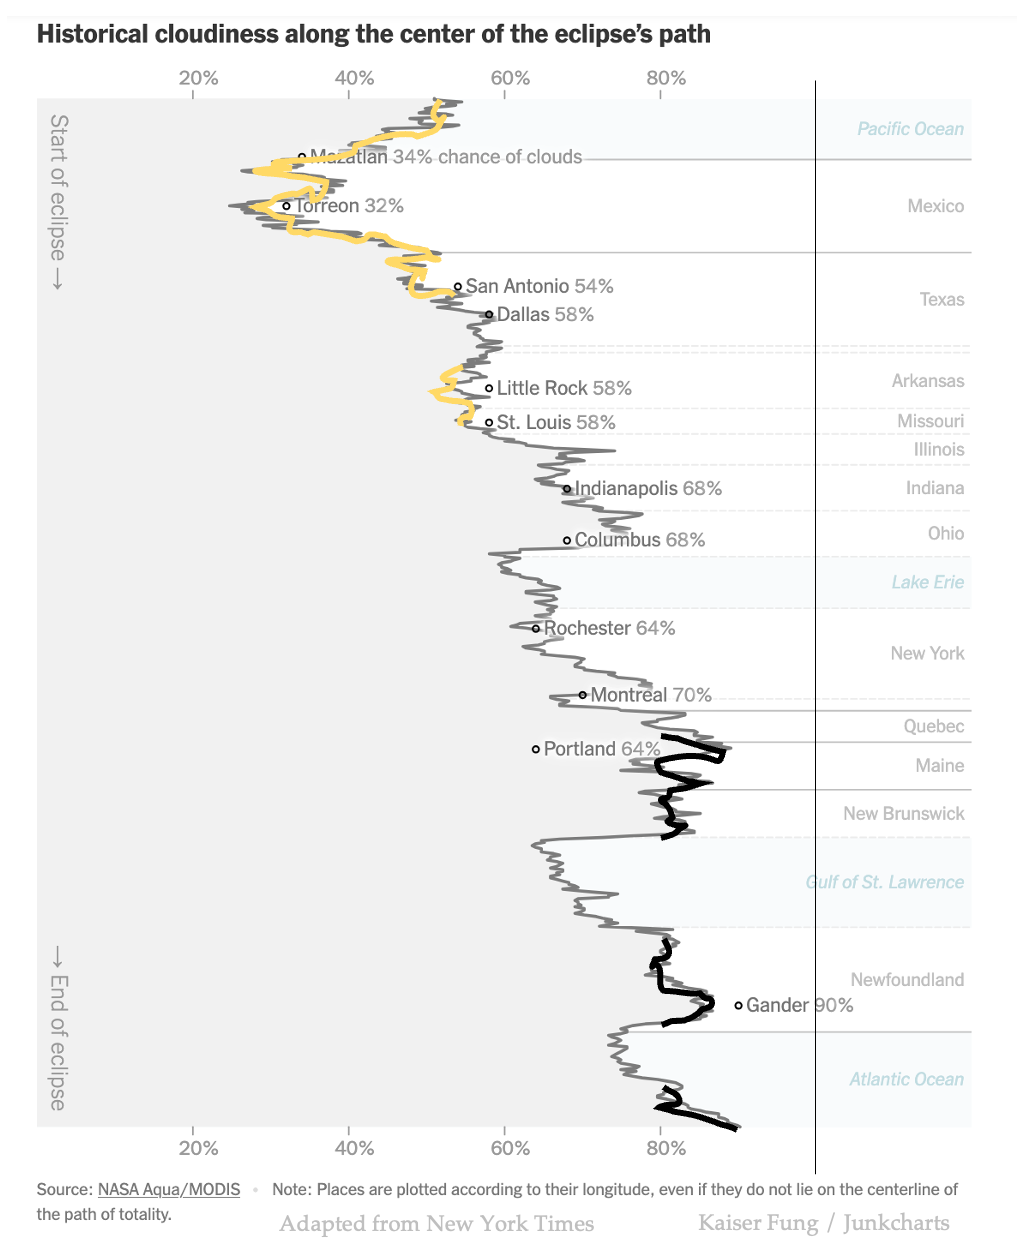
Instead of being plunged directly into a complex graphic, I have utilized the ladder of abstraction to present important components, one at a time, building up to the final abstraction.
P.S. I haven't found an elegant way to explain turning the line chart sideways so a small gap persists.