Junk Charts
About
RSS
Posts by Year
Posts by Keywords
Sign in
Subscribe
Time series
sports analytics
Making sense of long data sequences
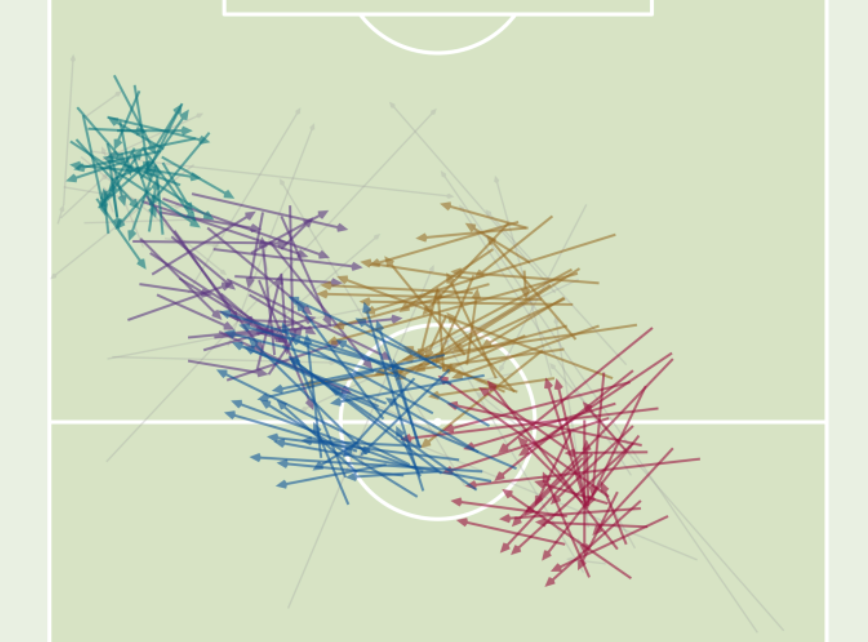
Visualizing football tactics
line chart
Rearranging deck chairs
A recipe for improving data visualization
Economics
The beef on beef
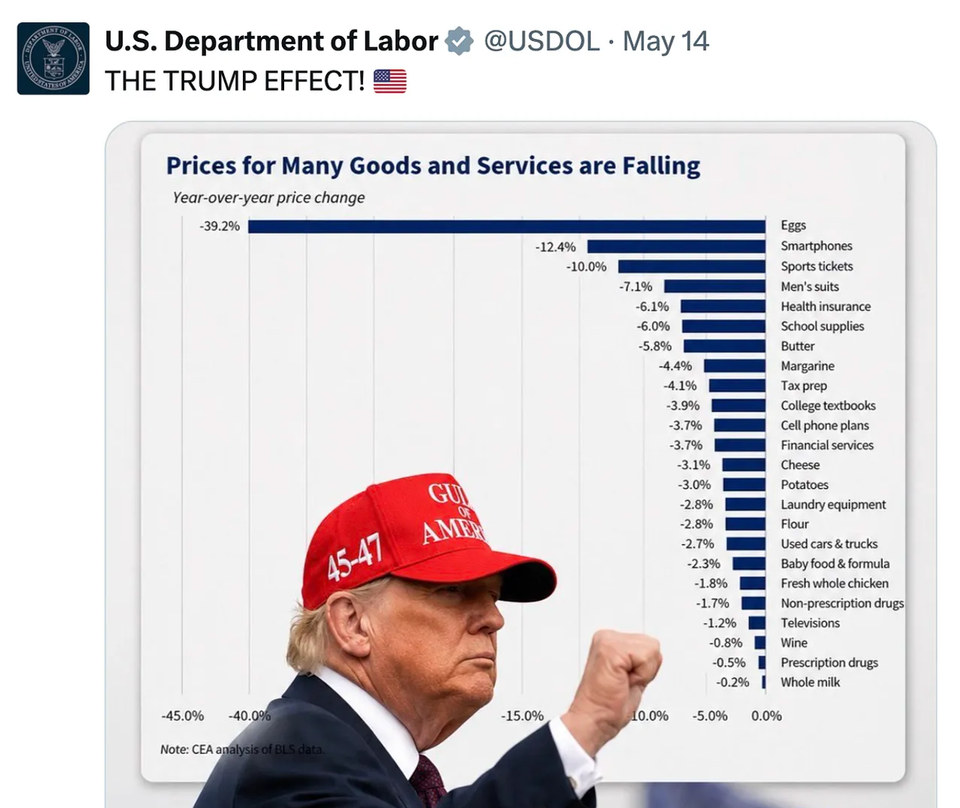
Another chart of prices
Politics
With editing power comes responsibility
Using and abusing
unemployment
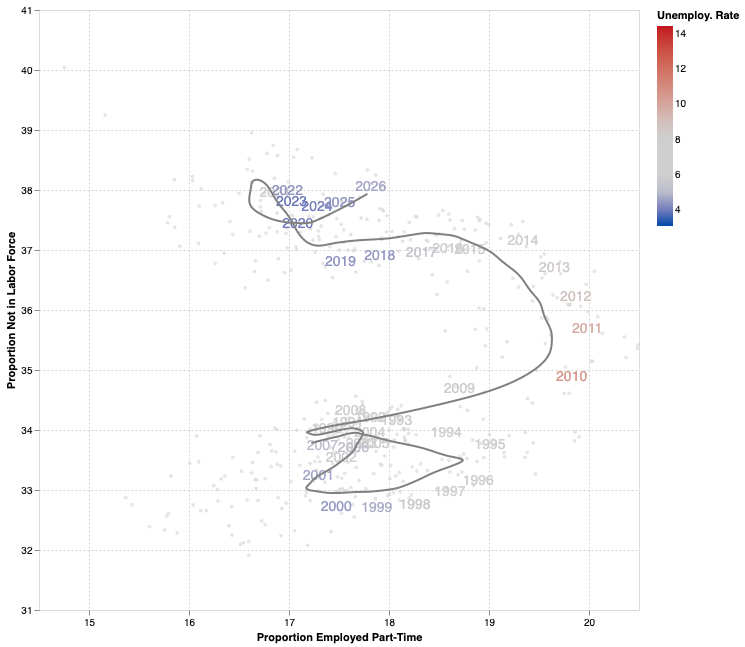
Updating the unemployment chart
How is the U.S. labor market doing in 2026?
Environment
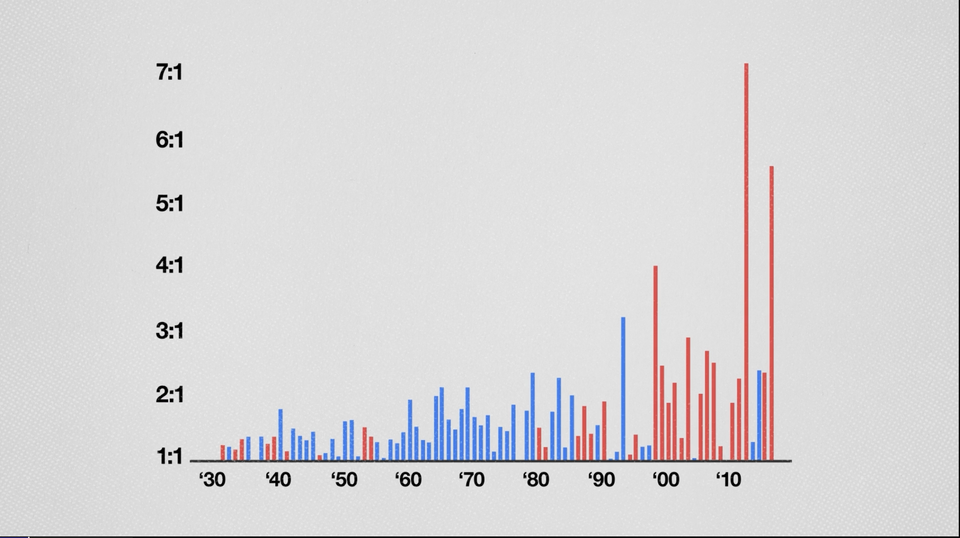
The climate chart that sparks a count v ratio debate
Also the null hypothesis
Page 1 of 22
Older Posts
→