On the bubble

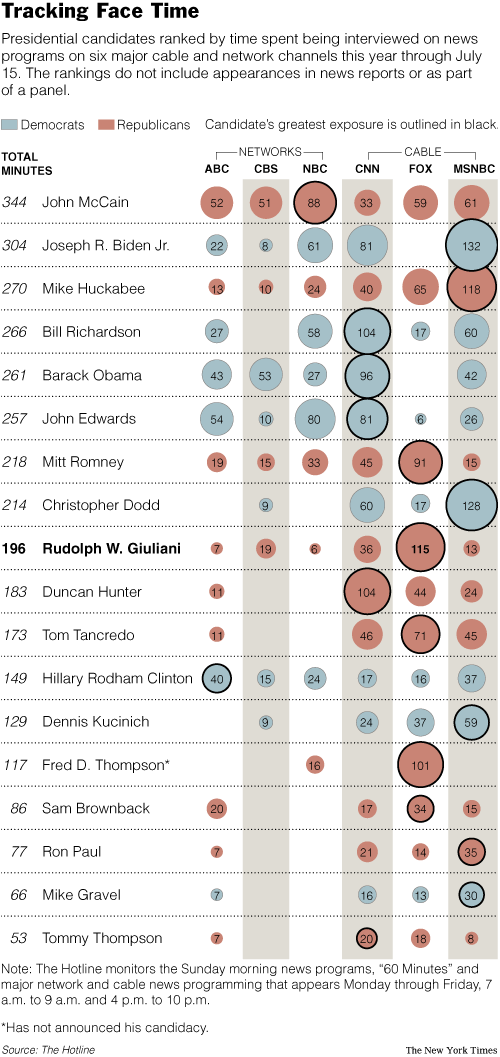
A couple of you noticed this table of bubbles in the Times, and asked what I think of it. Dustin J suggested that this could be considered a decent application of bubble charts. I agree, with some reservations.
The data set is the best thing about this chart. The riches that lay beneath! Many questions can be addressed, including:
- Which Presidential candidates are getting the most face time?
- Are candidates seen equally often across the stations?
- Are there differences between network and cable stations in terms of total face time? In terms of individual face time?
- Are there Democratic/Republican leanings by station? by type of station?
The intrepid can even build a regression out of it.
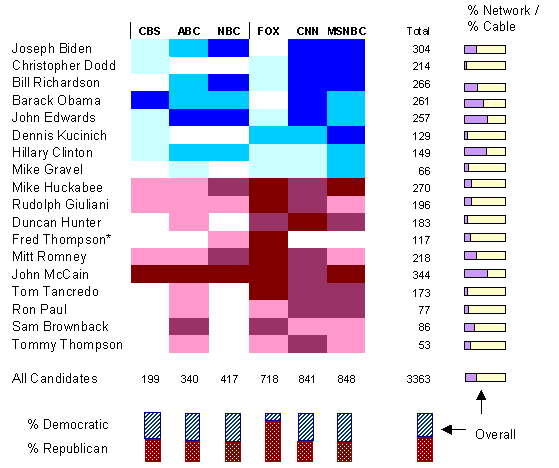
The bubble chart contains answers to all those questions but nothing jumps out. Okay, it's easy to see the station that gives each candidate the most face time. Anything else requires moderate to a lot of effort. Here's the junkart version.

The list of things done to the data is long:
- Candidates are grouped together by party
- Candidates within each party are arranged in order of decreasing maximum face time
- Stations are arranged by increasing total face time, this order happens to retain the network vs cable divide
- A heat map construct is used instead of bubbles: the legend is missing but there are four hues for each color: darkest = top 10%; medium = 10th - 50th percentile; light = bottom 50th percentile excepting zeroes; white = no face time. In raw numbers, 90th percentile = 81 minutes, 50th percentile = 19 minutes.
- The only data shown are the totals by candidate and totals by station.
- On the right margin are little bar charts that show the distribution of network/cable for each candidate.
- On the bottom margin are little column charts showing the distribution of party affiliation by station.
A few observations follow:
- Cable stations gave much more face time to the candidates in general. Fox, no surprise, gives Republicans 85% of its time while all the others were roughly equal.
- The more mainstream the candidate, the balanced was the time spent on networks versus cable. John McCain (R), Hillary Clinton (D) and John Edwards (D) had the highest proportion of network time.
- More time is not necessarily good since McCain was the clear winner but his campaign is struggling
Source: "Tracking Face Time", New York Times, August 1, 2007.


