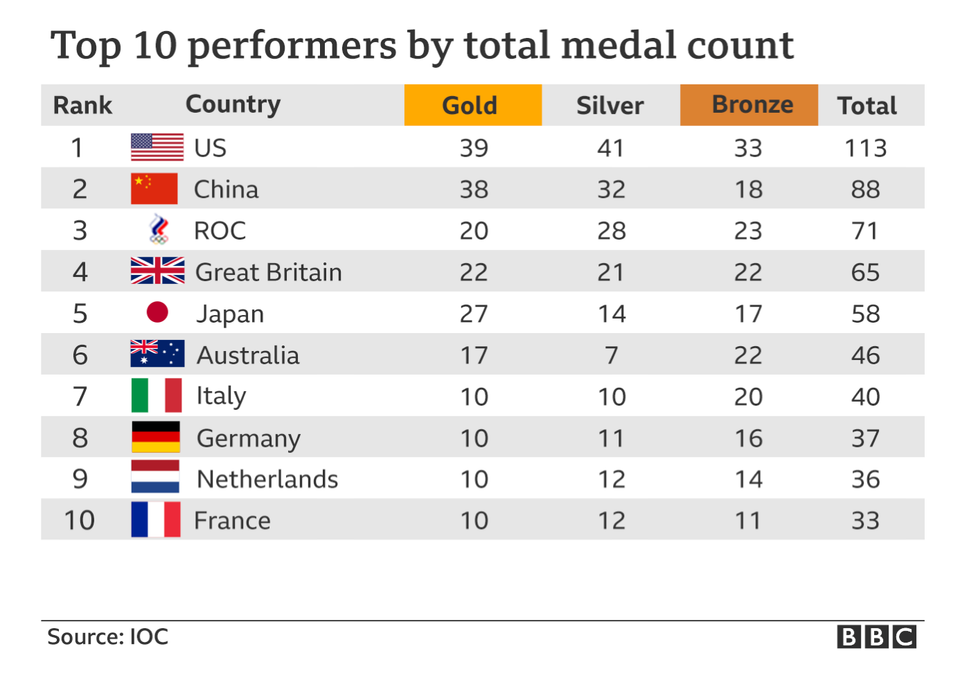
Big Data Demo of how data can tell any story you want, ode to Tokyo Kaiser completes a challenge: come up with ways to rank any country #1 in the Tokyo Olympics.
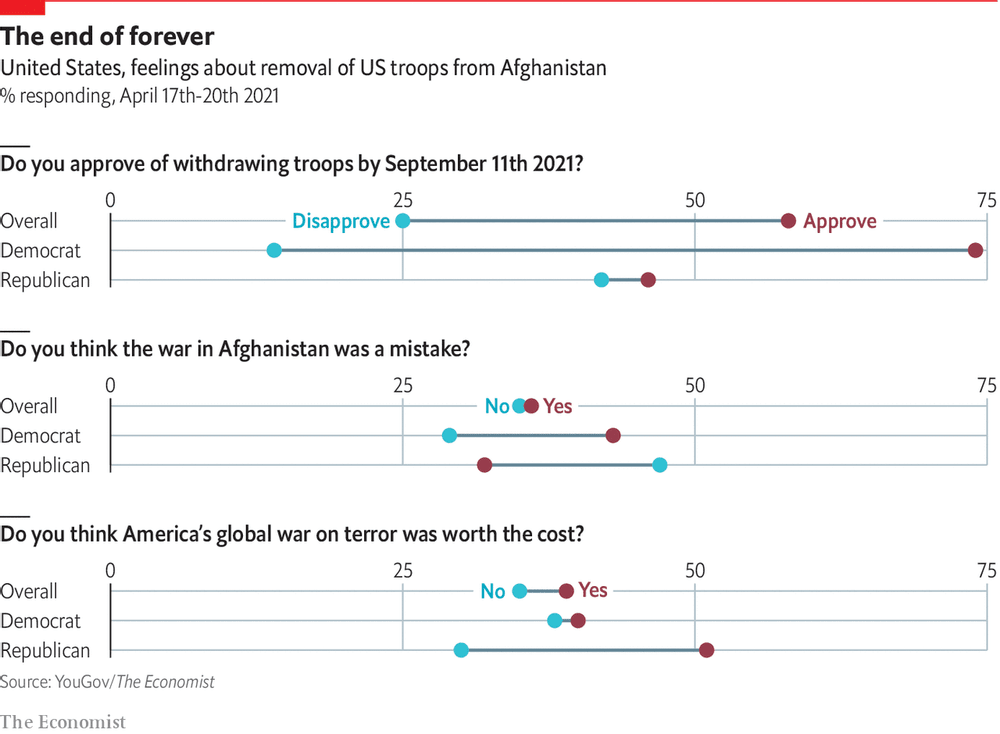
return on effort Reading this chart won't take as long as withdrawing troops from Afghanistan Kaiser deciphers a chart showing Americans' response to Biden's decision to withdraw troops from Afghanistan.
ray vella Two commendable student projects, showing different standards of beauty Kaiser discusses two dataviz projects by NYU students.
Covid-19 Probabilities of Covid-19 Kaiser looks at how probabilities lie behind the science of vaccines.
Assumptions Blood clots: is there a there Kaiser looks at the controversy over blood clots and the Astrazeneca vaccine.
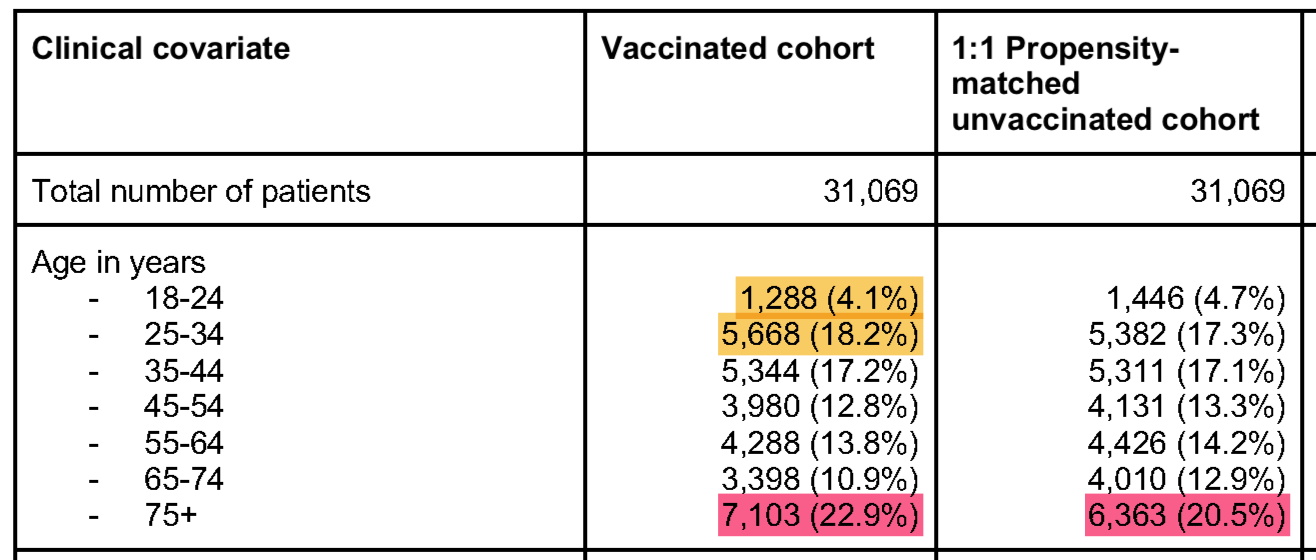
Cause-effect Real-world studies: limits of knowledge Kaiser focuses attention on a few aspects of the Mayo Clinic real-world effectiveness study.