Playthings in an unreal world

It's been said that the economic models used by many mainstream economists this decade suffered from a fatal flaw: that of many unrealistic assumptions (such as no speculative bubbles) that are often needed to "make the math work"; sometimes, these are not direct assumptions but consequences of other assumptions. See for example Willem Buiter, Paul Krugman, Scientific American.
Another favorite plaything of economists is the so-called "Big Mac index". The Economist magazine, which seems to own this toy, proclaims it "the most accurate financial indicator to be based on a fast-food item", and the sub-title of the page is "Exchange-rate theory". It is the cost in US$ of a Big Mac overseas divided by the cost of a Big Mac in the U.S., and is an indicator of whether the current foreign exchange rate (vs. US$) is over-valued or under-valued.
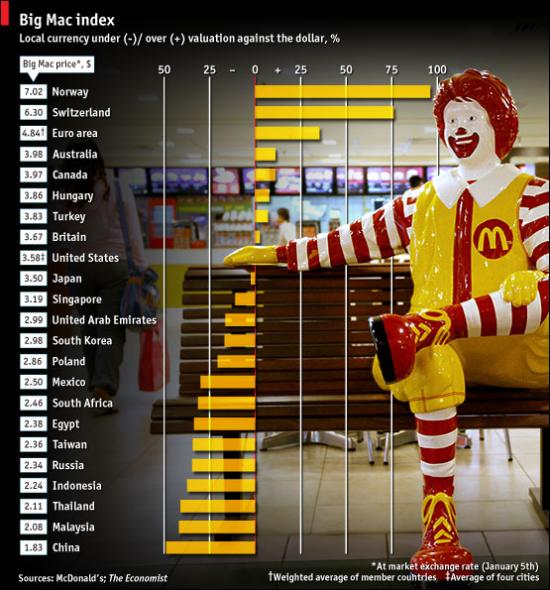
I saw this chart on the Business Insider site, where a claim is made about the Chinese currency being undervalued by 50%.
Sadly, the Economist has gone the way of USA Today in embellishing its graphics with distracting, loud, uninformative images. Besides the chartjunk, we should always place the zero line in the middle of the chart for this sort of scale where the data could theoretically lean in either direction. This allows readers to mentally judge the magnitude of the differentials. As pointed out by zbicylist, this statement isn't appropriate to this particular scale. The scale chosen has the peculiar range of between -100% and +infinity: in order to help readers appreciate this, I would set the left edge of the scale to -100%, and let the right edge expand to cover the actual data.
Food for thought: could it be that under this economic "theory", the US$ can never be over- or under-valued, that it is always correctly valued?


