Replicating science
I have a new paper that just came out (link), coauthored with Peter Doshi, Mark Jones and Linda Wastila, entitled "Transparency of clinical trials: reproducing and extending analyses".
This paper stems from some work we did to make use of the release of many thousand documents from Pfizer's Covid-19 vaccine trial. This release was made possible by a FOIA request, made in the public interest since the vaccines were subsidized by a lot of public funds.
The trove of documents was vast but disorganized. Our primary goal is to replicate the results published in Thomas, et. al, a key document upon which the vaccine's emergency approval was based (link). A secondary goal is to perform further analyses using the released datasets to answer additional questions.
We fished out the datasets and SAS codes used to generate the tables and charts in Thomas, et. al. We picked out several key effectiveness and safety outcomes tables, annotated the SAS codes, and were able to reproduce almost all of the numbers. That is good news.
We stumbled upon one key omission. Remember this famous chart:
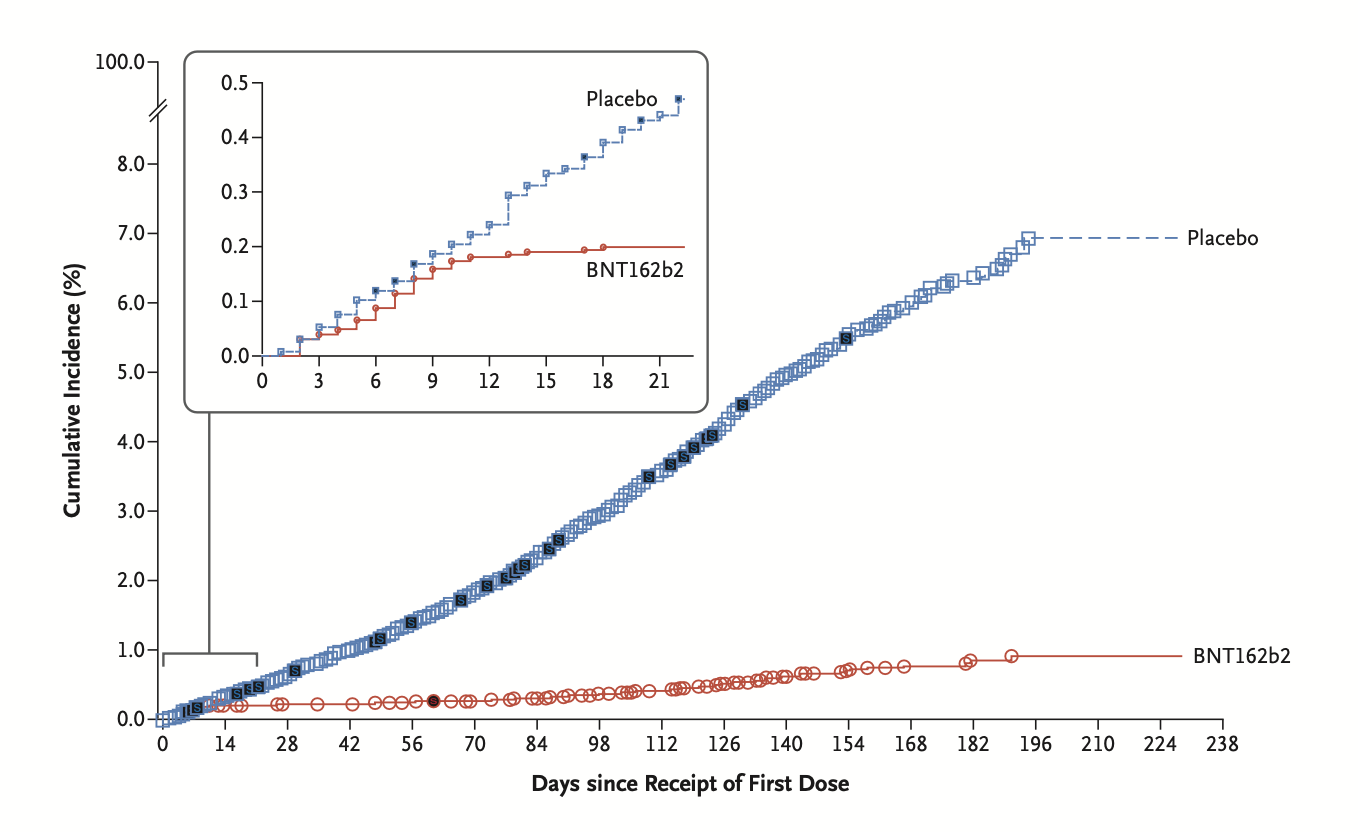
We couldn't find the code to reproduce it. The code that generates the results in other tables collapses the time axis in various ways. The graph requires day by day counts.
We went further to compute additional analyses. Recall that the narrative shifted from cases to serious cases to hospitalizations, as the pandemic evolved. Instead of preventing infections or cases, the vaccines were said to protect against serious cases, hospitalizations, and deaths.
Since those end points were not in the trial protocol, they were not officially reported (the scientific reason is that the trial did not contain sufficient participants to detect rare signals such as those). But the released datasets contain information to conduct an analysis of efficacy against Covid-19 hospitalizations. Here, we encountered a difficulty.
The number of cases flagged as Covid-19 hospitalizations (43) exceeded the number of cases labeled serious cases (31). This raises the possibility that some patients with non-serious Covid-19 might have been admitted.
This is the kind of data provenance issue frequently encountered in practical data science: unless the analyst has a firm grasp of how each piece of data were collected and measured, the analytical findings can't be explained.
One of our contributions is annotating the SAS codes, uploaded here.