Round 2: 10 Ways to Rank the Rio Summer Olympics
Kaiser finds another set of 10 metrics that can be used to rank any country top of the medals table.
In a recent post, I took data from the Tokyo Olympics to demonstrate how one can find any number of data-driven stories in a sufficiently complex dataset. I outlined 10 different ranking schemes that place a different country first.
A few readers noticed and complained that the metric used for Germany was "not positive". They didn't like the insight that Germany saw the greatest decline in medals from Rio 2016 to Tokyo 2020. While "not positive" metrics have their practical uses, I indeed was hoping to make a purely "positive" post, and ran out of time. (I said the challenge can be completed; I never said it was easy!)
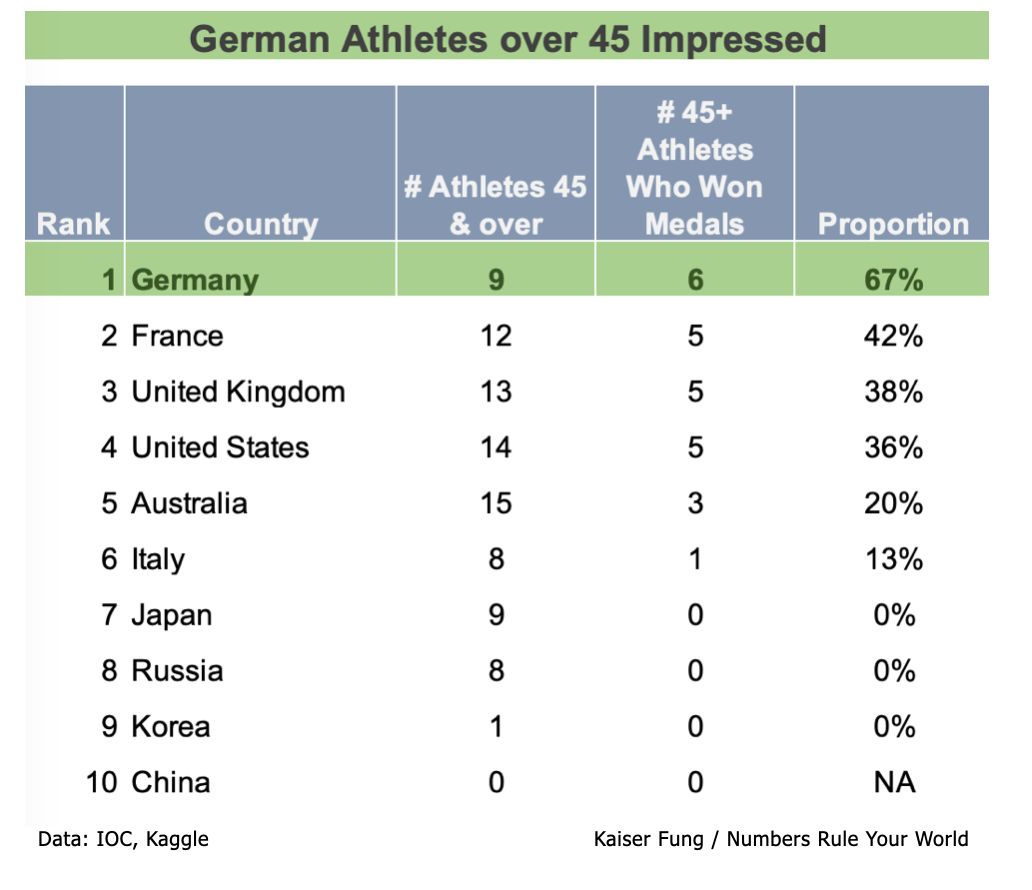
Since today is a new day, and this is a new post, I will now close the gap. Germany's older athletes, those over 45 years and over, were by far the strongest. Incredibly, two out of three earned medals.

Now, surely no one can question the completeness of my answer.
***
Since a few of you were cheering for me to fail, I decided to double down, and present to you another 10 metrics, proving that if you spend enough time with the data, you can pretty much say anything you want.
Scratch that. In the course of doing this second round, I bumped into one of those awkward data science moments: you see, the exploratory analysis caused me to look up an athlete's bio, and doing so, I discovered that the spreadsheet I snatched online did not show Tokyo athletes as expected but athletes from Rio 2016. So in this second round, what I will deliver is the same challenge but using strictly the data from the Rio 2016 Summer Olympics.
As before, I start with the official top 10 medals table from Rio 2016.

Nine of the 10 countries are the same as before. The Netherlands was swapped for South Korea. (Russia competed under its proper name rather than ROC.)
The United States won on four metrics, golds, silvers, bronzes and total medals - and plenty of others, if you start digging around.

China won the second most medals at Rio 2016. But the Chinese team had the highest proportion of female athletes - by a wide margin.

Team GB came in #3. No other team, though, produced a gold winner older than Nick Skelton, who at 59 proved that age is no barrier.

Russia was 4th in the overall medals table. Its women athletes were the most efficient at earning medals.

Germany was #5. No other team achieved more success amongst older athletes - those 45 years old and over.

France came in #6. Among the top 10 countries, the French medal-winners had the highest age.

Japan was #7 overall. They were the mirror image of the French: the average Japanese medal-winner was the youngest.

Australia showed up in the 8th spot. The Aussie gold medalists were even younger than the Japanese.

The Azzurri placed 9th overall. Previously, we learned before that the Italians had the most close calls. It turned out their gold medal winners tended to be younger.

In Rio, South Korea squeaked in at the 10th position. The nation was unique in sending a team in which the women were older than the men.

I end on a strong note. This last metric was very satisfying as it single-handedly placed South Korea on on side of the ledger with the other nine countries on the other side.
***
There you have it. Take the Rio Olympics, and one can achieve the same result - one can find 10 metrics that rank each of the top 10 countries as #1.
This is the power of statistics. How one uses this power is a different matter. Use it to inform, not to mislead.
(For those who may be snorting at this exercise, notice that every statement I made about the Rio Olympics presented historical facts. I did not generalize these observations to the future. Some of these insights are likely to be artifacts of this historical dataset. It's when someone uses such insights to speak about the future when you should be concerned.)