Junk Charts
  • About
  • RSS
  • Posts by Year
  • Posts by Keywords
Sign in Subscribe

Aggregation

Interpreting margins of error in tennis calls
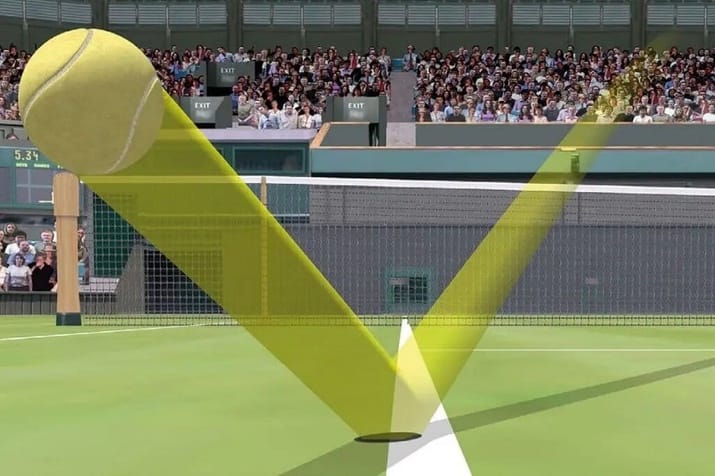
sports analytics

Interpreting margins of error in tennis calls

When two sources of evidence disagree: pick a winner or combine
Read More
Hammock plots
hammock plot

Hammock plots

Matthias Schonlau introduces the hammock plot.
Read More
Making major things easy, and minor things hard
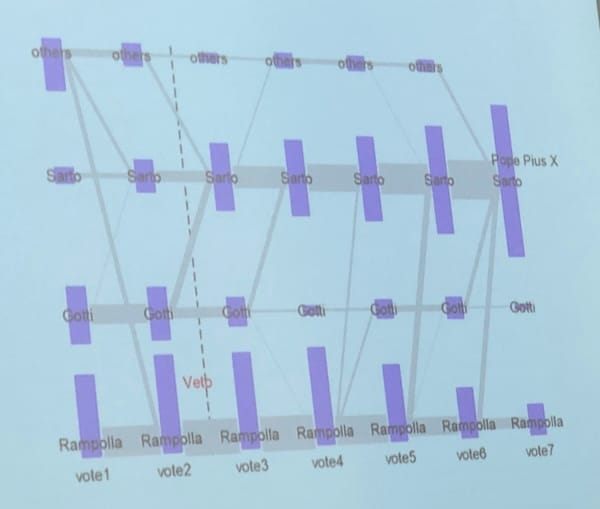
Aggregation

Making major things easy, and minor things hard

Making major things easy, and minor things hard
Read More
Deliberately obstructing chart elements as a plot point
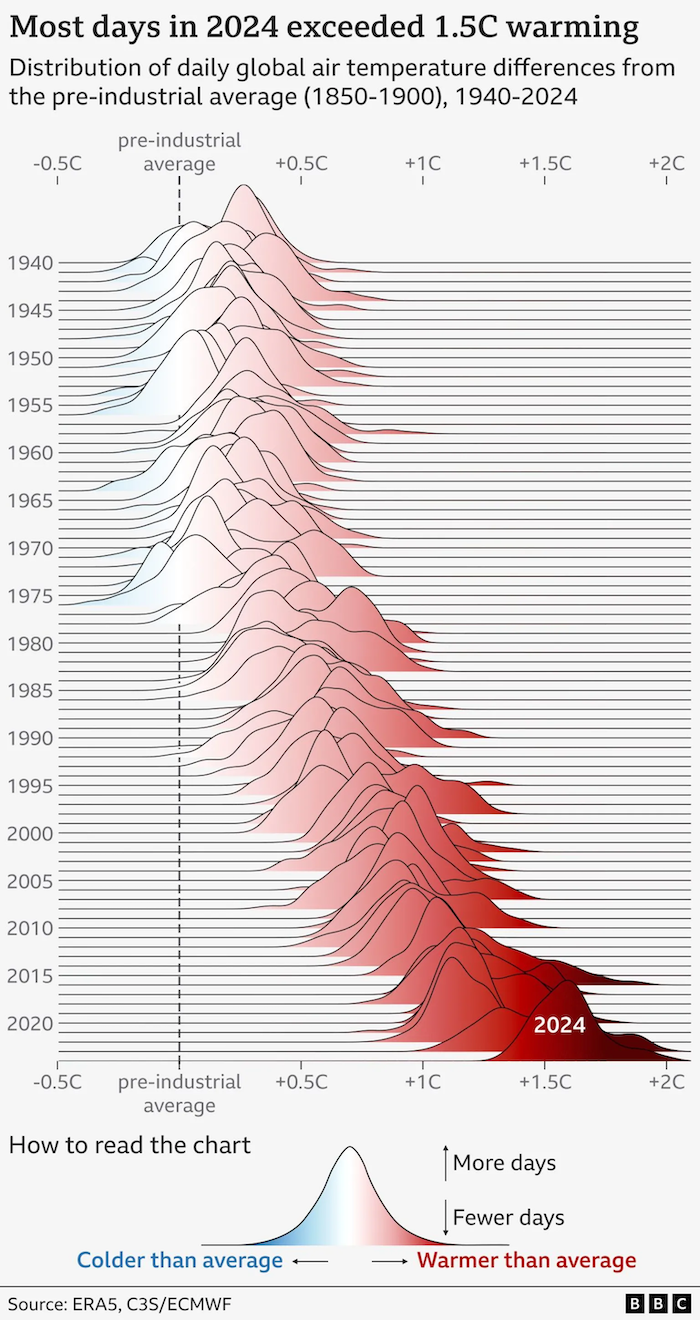
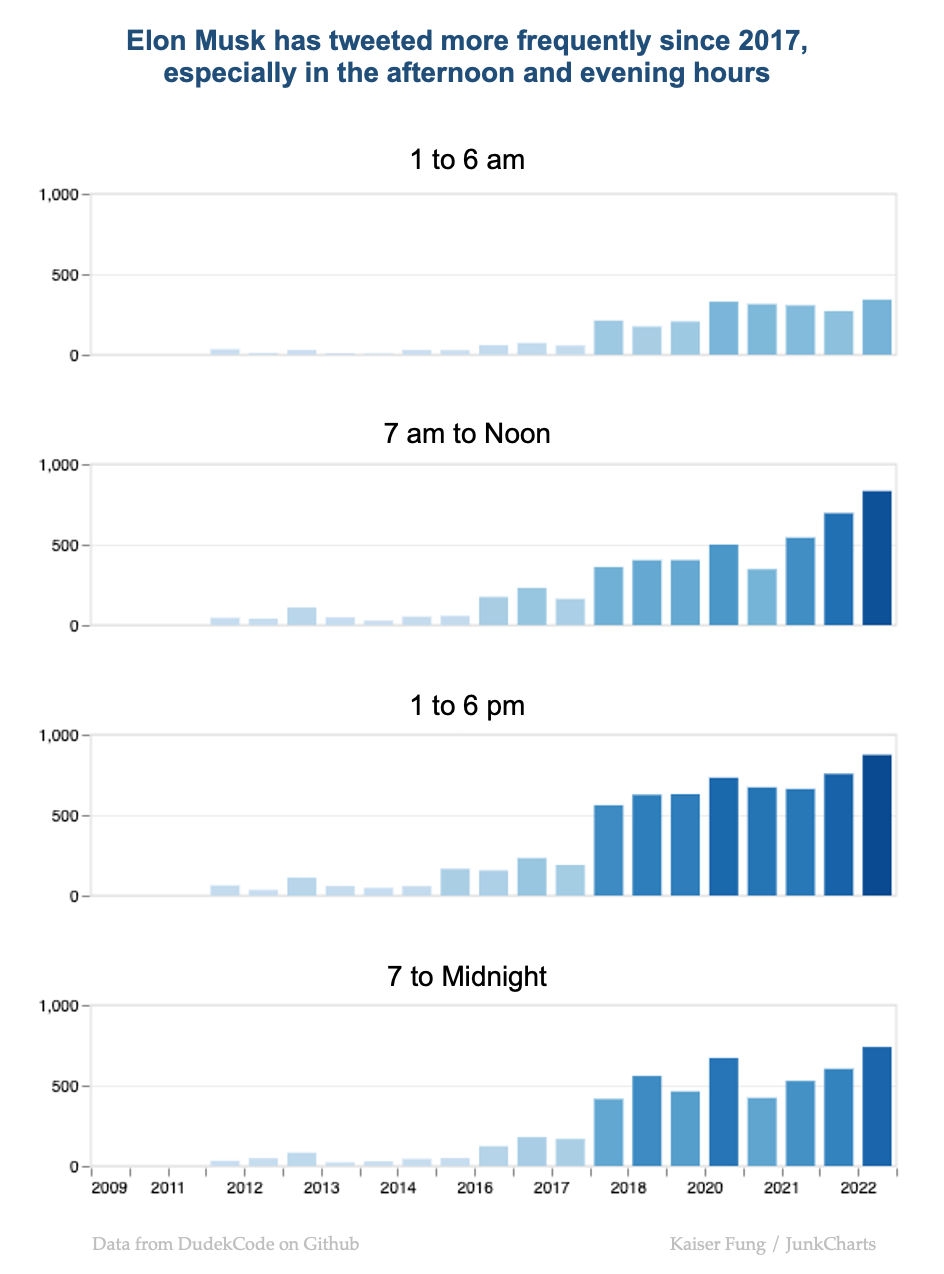
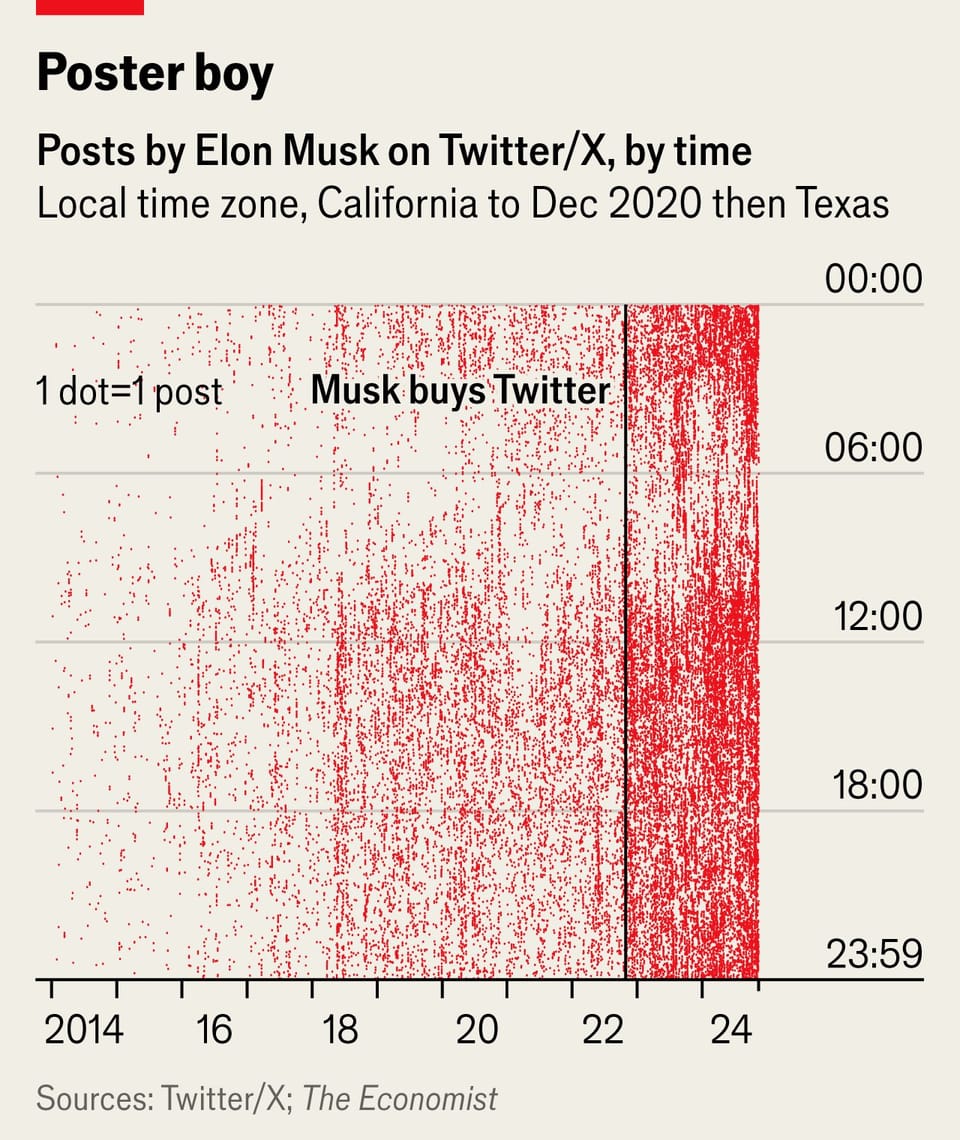
ridge plot

Deliberately obstructing chart elements as a plot point

These "ridge plots" have become quite popular in recent times.
Read More
Organizing time-stamped data
Aggregation

Organizing time-stamped data

Re-organizing the time stamps of Elon Musk tweets
Read More
Don't show everything
Aggregation

Don't show everything

Plotting lots of data but conveying not much information
Read More
← Newer Posts Page 2 of 18 Older Posts →
Junk Charts © 2025
  • BOOKS
  • COURSES
  • PRESS
  • CONSULTING
  • COACHING
  • CONTACT
Powered by Ghost