Junk Charts
About
RSS
Posts by Year
Posts by Keywords
Sign in
Subscribe
Aggregation
Aggregation
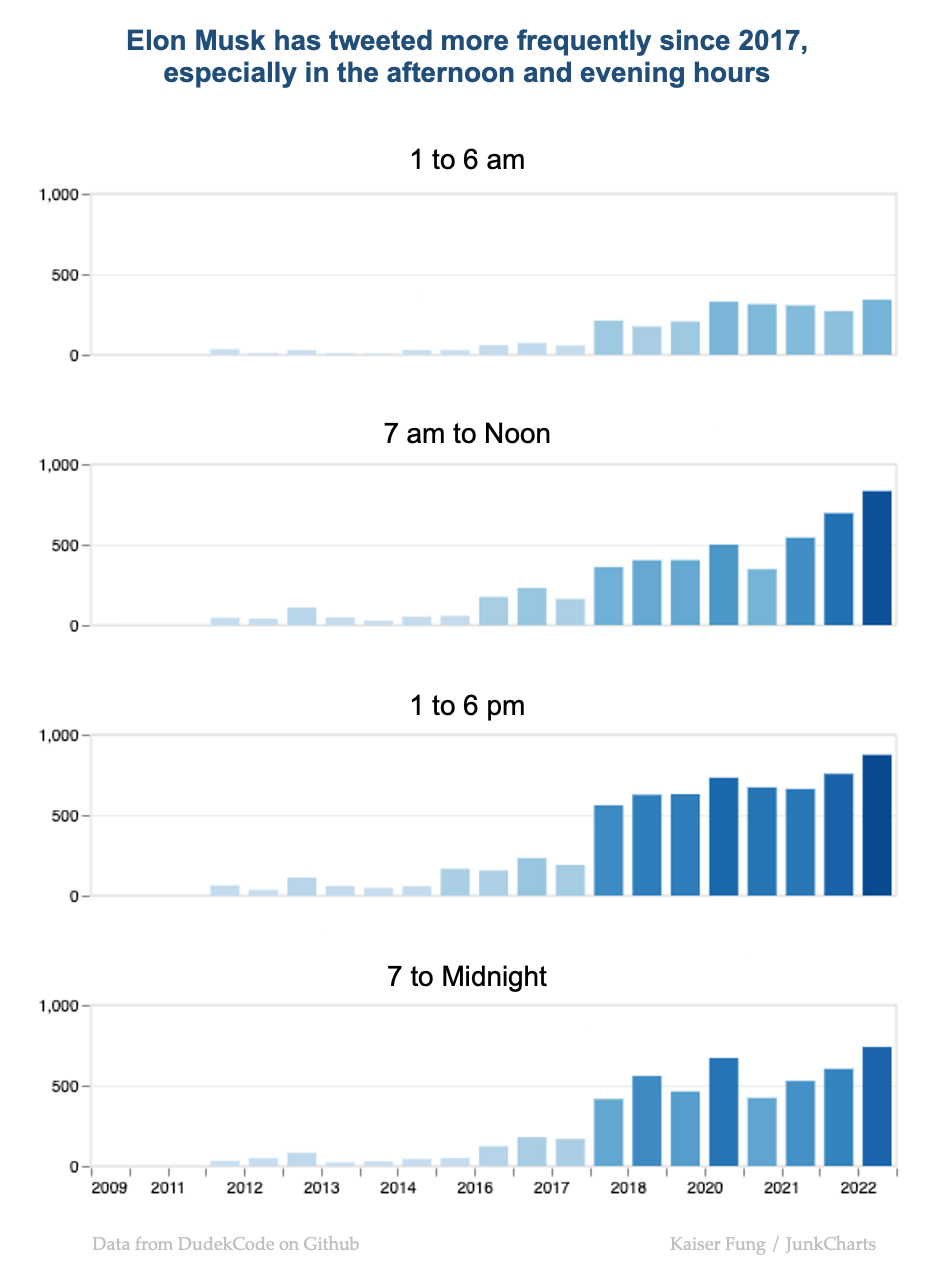
Organizing time-stamped data
Re-organizing the time stamps of Elon Musk tweets
Aggregation
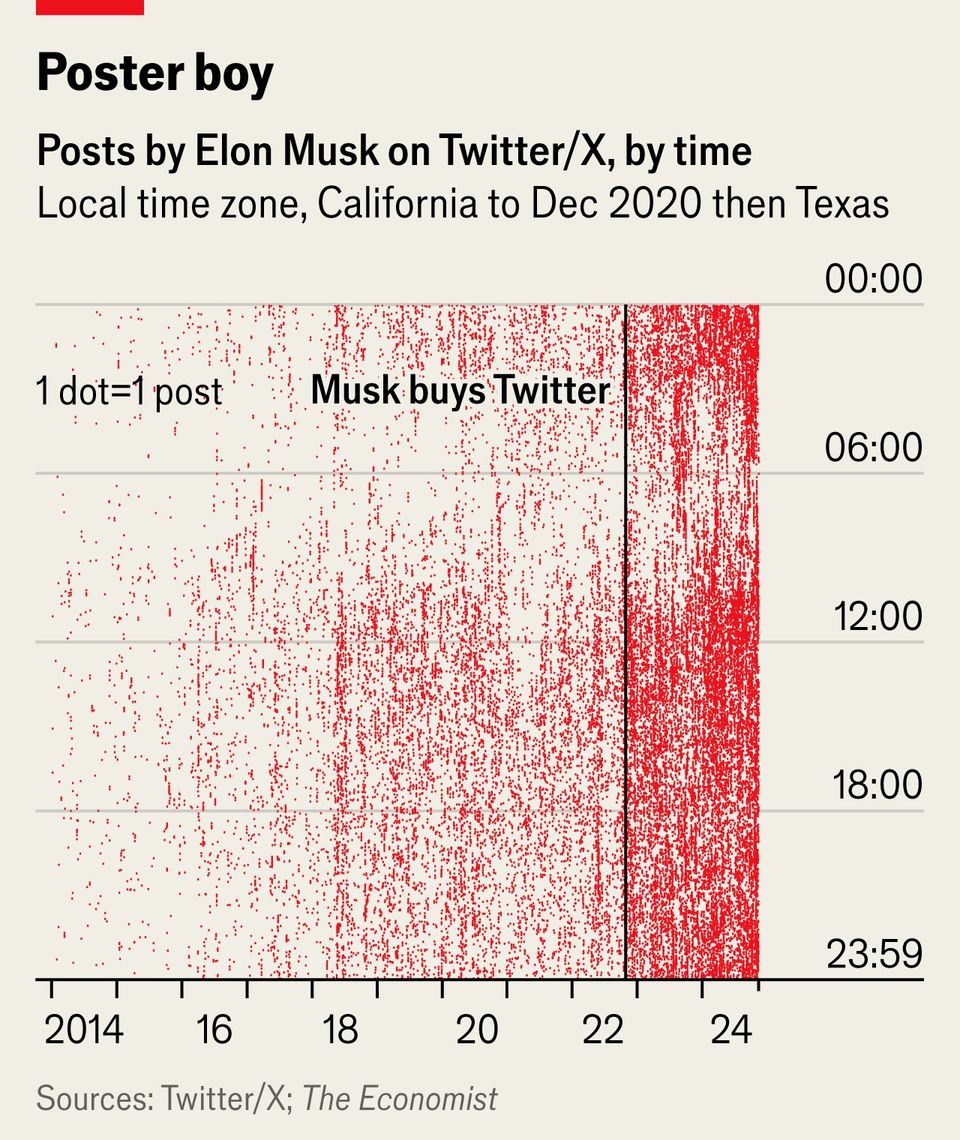
Don't show everything
Plotting lots of data but conveying not much information
Aggregation
The science of counting more people using fewer people
Trying to count more with less
Boxplot
Five-value summaries of distributions
Using five numbers ot summarize data distributions
Aggregation
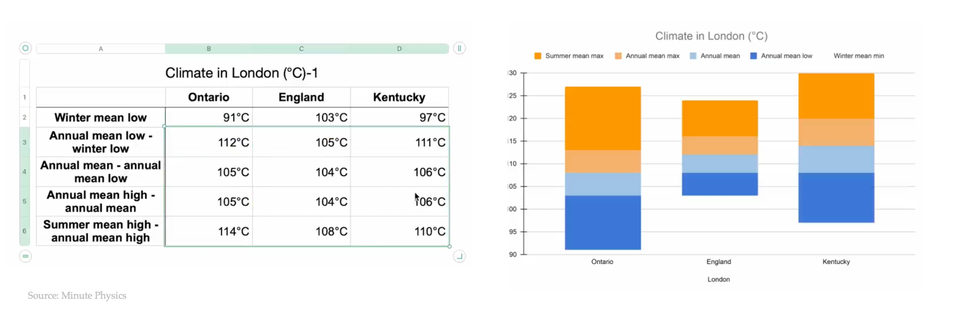
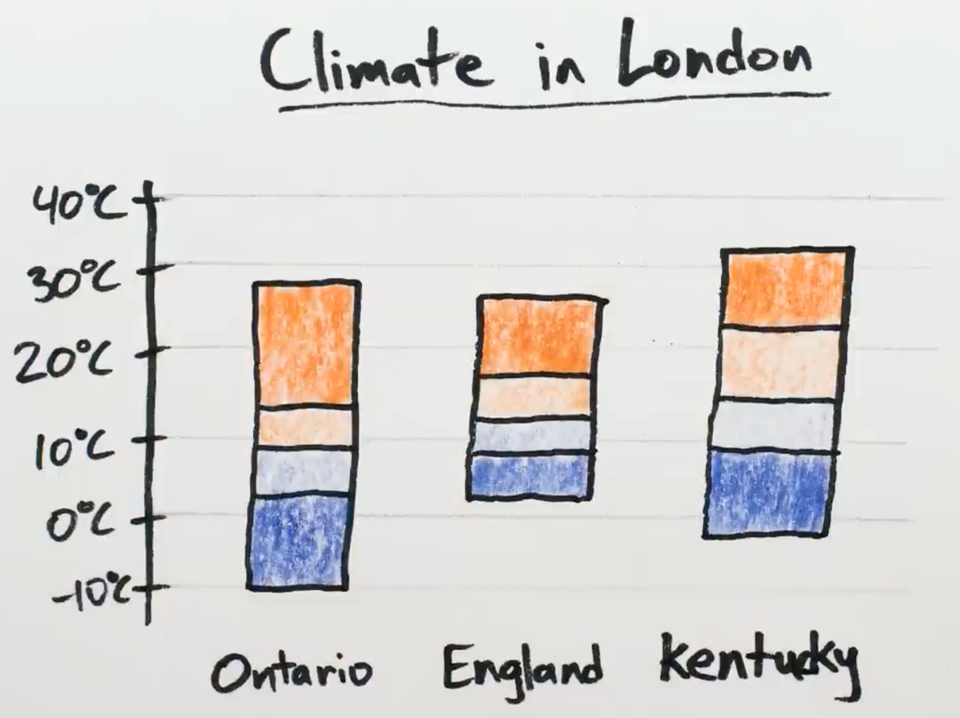
What is this "stacked range chart"?
Do we need this "stacked range chart"?
Aggregation
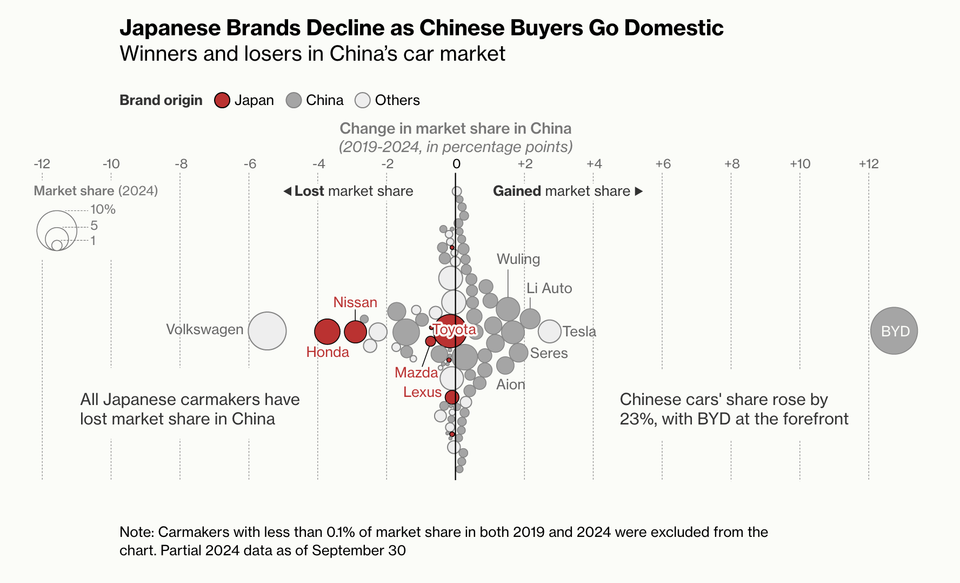
Dot plots with varying dot sizes
An example of a dot plot with varying dot sizes
←
Newer Posts
Page 3 of 19
Older Posts
→