Junk Charts
  • About
  • RSS
  • Posts by Year
  • Posts by Keywords
Sign in Subscribe

Aggregation

Election coverage prompts good graphics
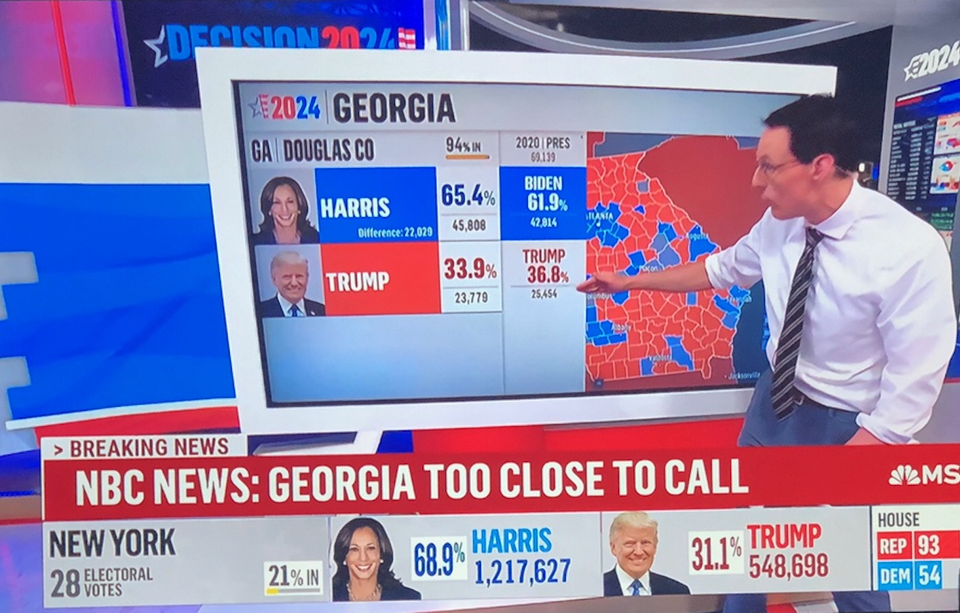
Aggregation

Election coverage prompts good graphics

Election coverage brings out the best of interactive graphics
Read More
The election could have been called much earlier
Aggregation

The election could have been called much earlier

What does it mean by too close to call
Read More
Hurricane insurance merry-go-round
Aggregation

Hurricane insurance merry-go-round

The hurricane insurance business, 15 years later
Read More
Visualizing extremes
Aggregation

Visualizing extremes

Nice NYT chart showing weather extremes
Read More
Know your data 41: the lesser evil
Aggregation

Know your data 41: the lesser evil

Is Mozilla not good enough?
Read More
Using disaggregation in dataviz
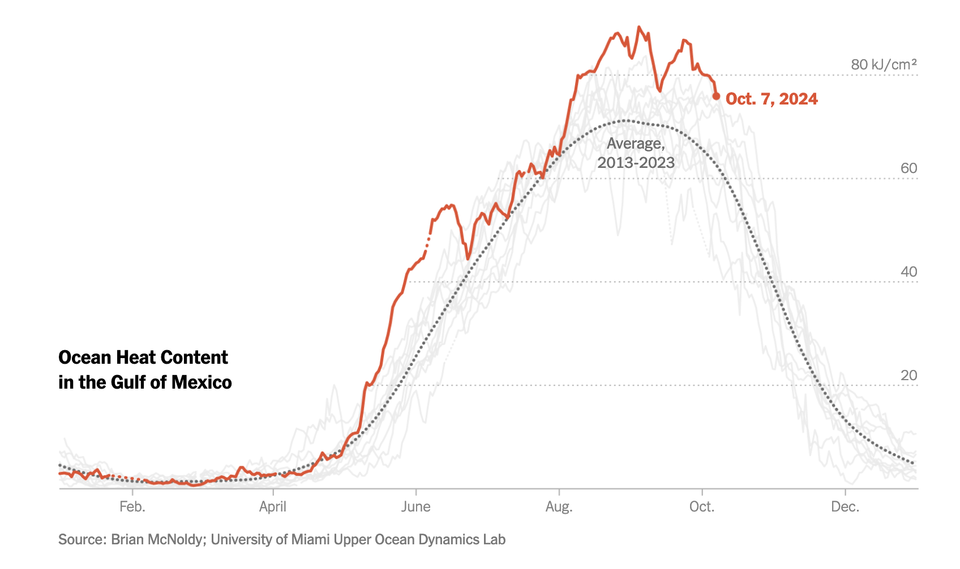
Aggregation

Using disaggregation in dataviz

Disaggregating data can be very useful when making charts
Read More
← Newer Posts Page 4 of 19 Older Posts →
Junk Charts © 2026
  • BOOKS
  • COURSES
  • PRESS
  • CONSULTING
  • COACHING
  • CONTACT
Powered by Ghost