Junk Charts
  • About
  • RSS
  • Posts by Year
  • Posts by Keywords
Sign in Subscribe

Aggregation

Using disaggregation in dataviz
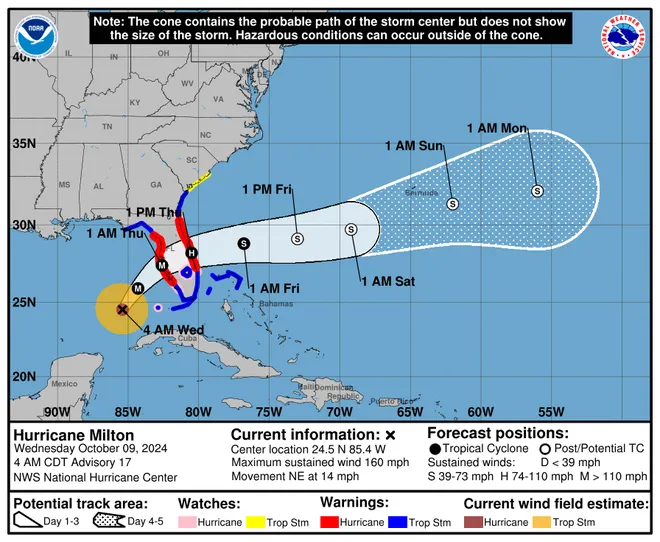
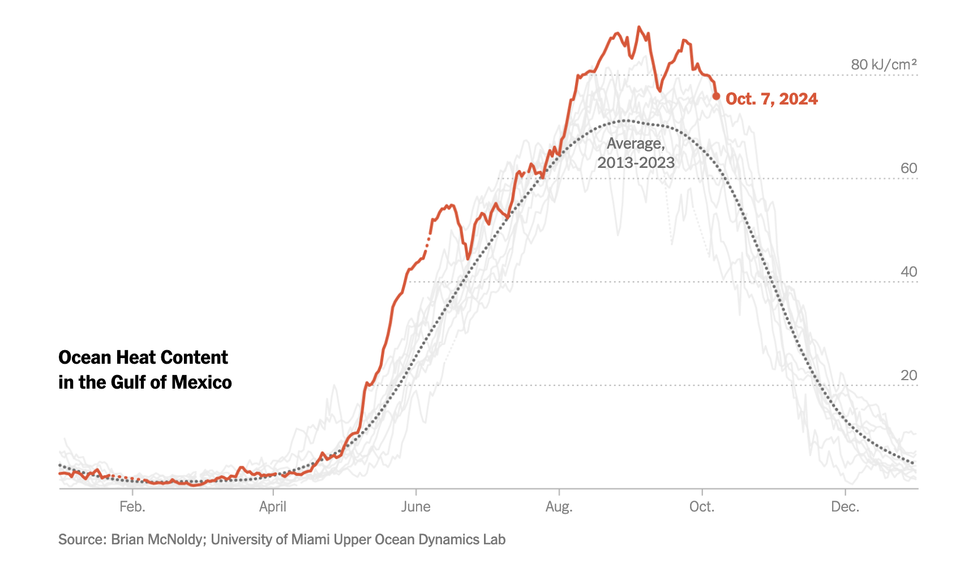
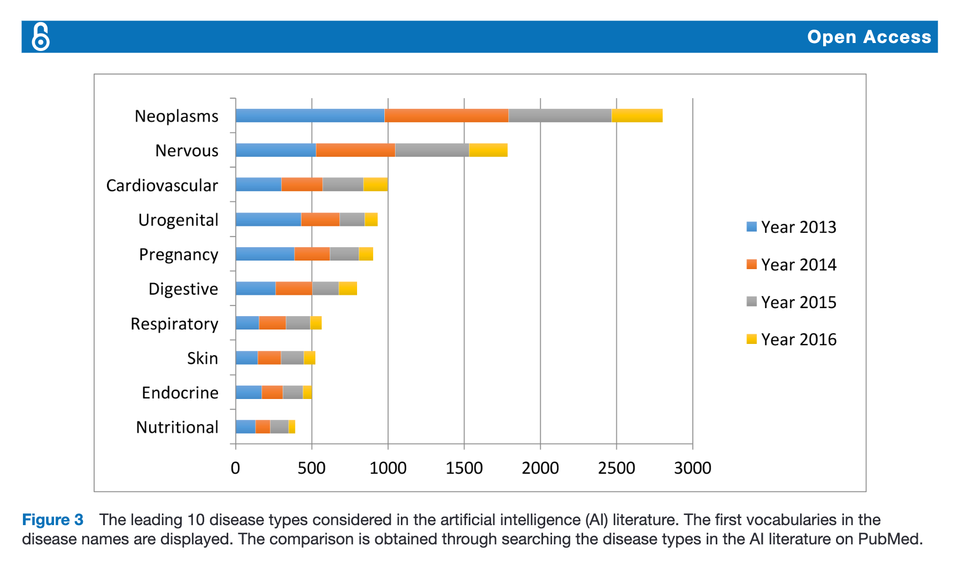
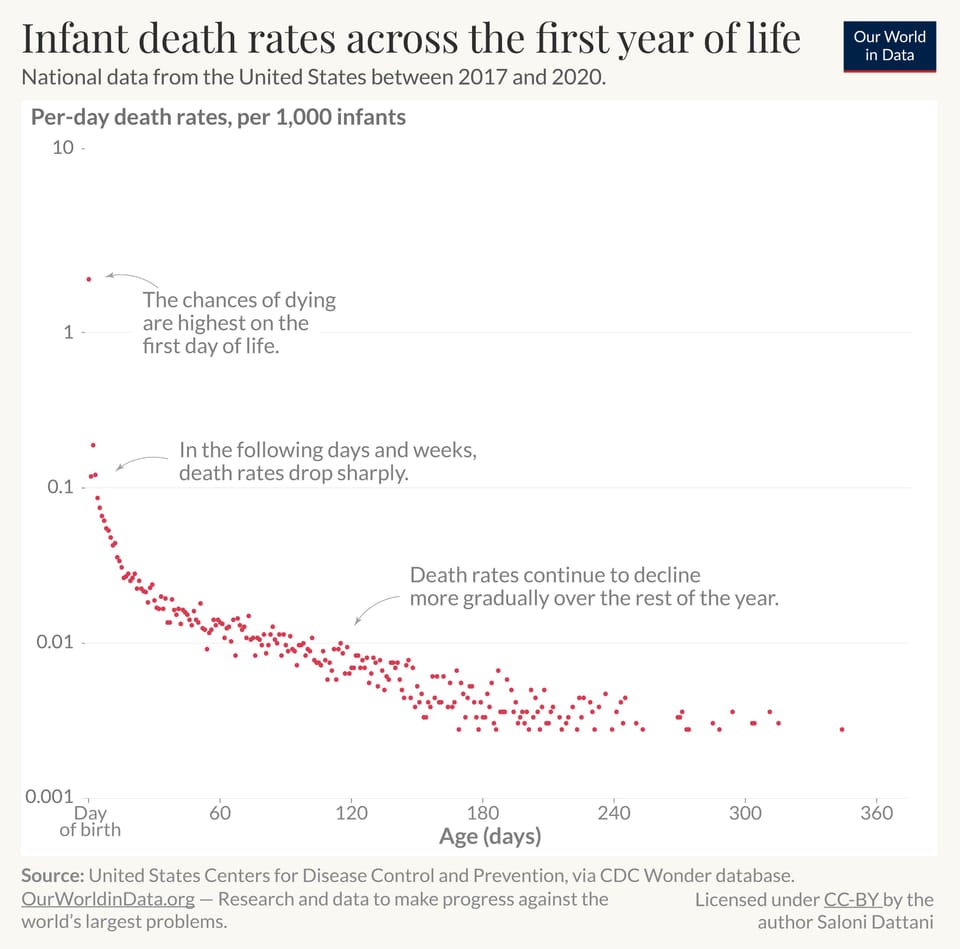
Aggregation

Using disaggregation in dataviz

Disaggregating data can be very useful when making charts
Read More
The most dangerous day
Aggregation

The most dangerous day

The most dangerous day in one's life
Read More
Combining probabilities
Aggregation

Combining probabilities

Kaiser explains how probabilities are aggregated.
Read More
One doesn't have to plot raw data
Aggregation

One doesn't have to plot raw data

Kaiser looks at gold production worldwide.
Read More
The curse of dimensions
Aggregation

The curse of dimensions

Kaiser considers some bubble maps.
Read More
What's a histogram?
Aggregation

What's a histogram?

Kaiser introduces his talk about histograms.
Read More
← Newer Posts Page 4 of 16 Older Posts →
Junk Charts © 2025
  • BOOKS
  • COURSES
  • PRESS
  • CONSULTING
  • COACHING
  • CONTACT
Powered by Ghost