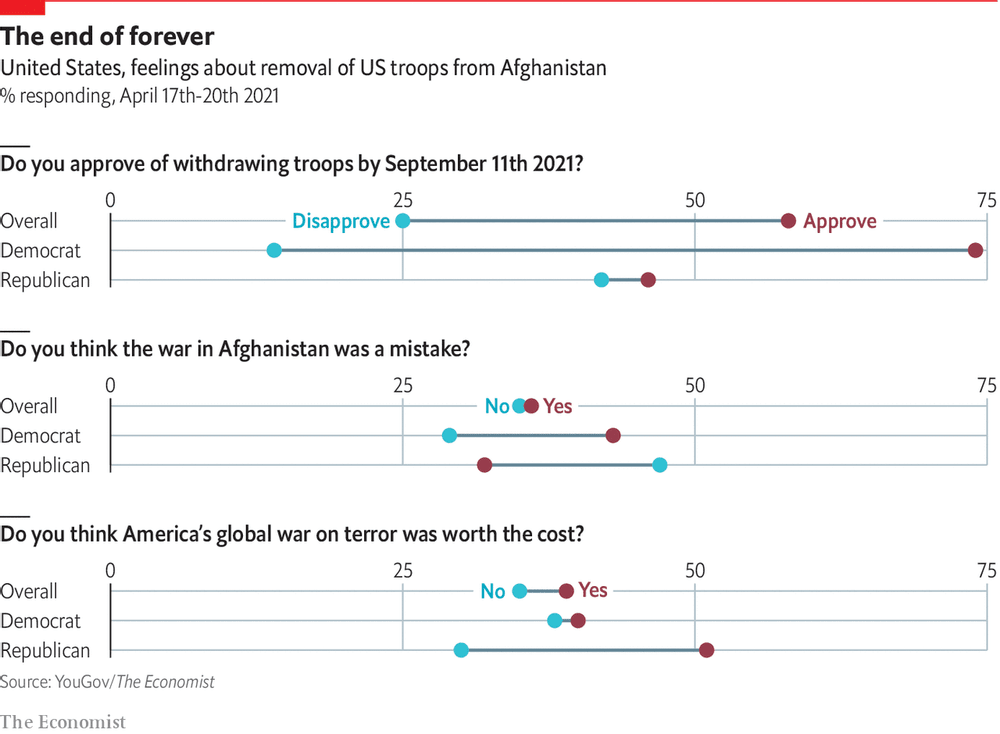
return on effort Reading this chart won't take as long as withdrawing troops from Afghanistan Kaiser deciphers a chart showing Americans' response to Biden's decision to withdraw troops from Afghanistan.
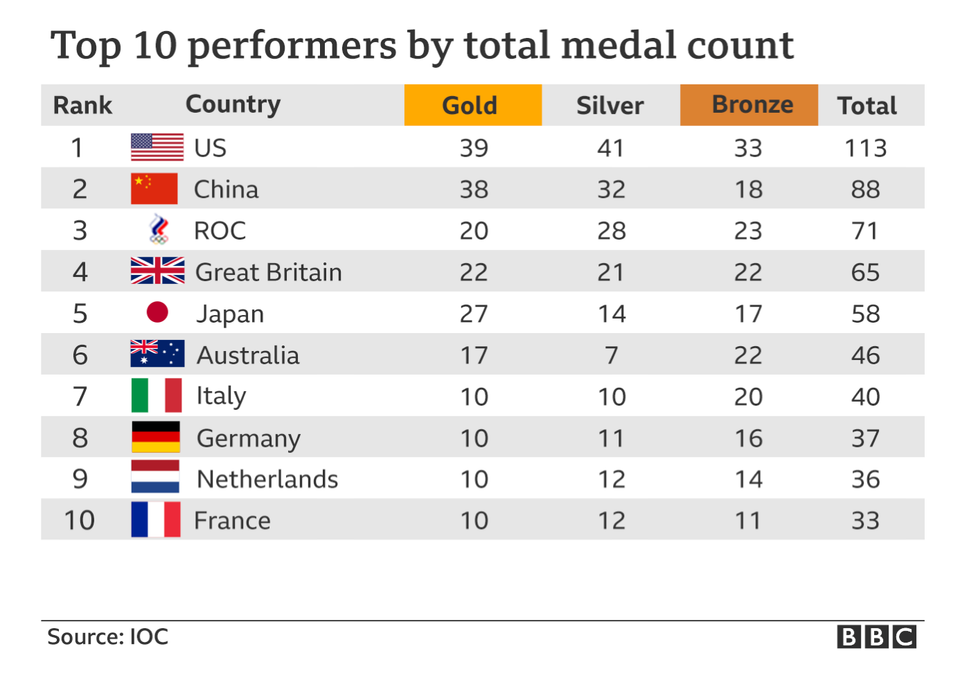
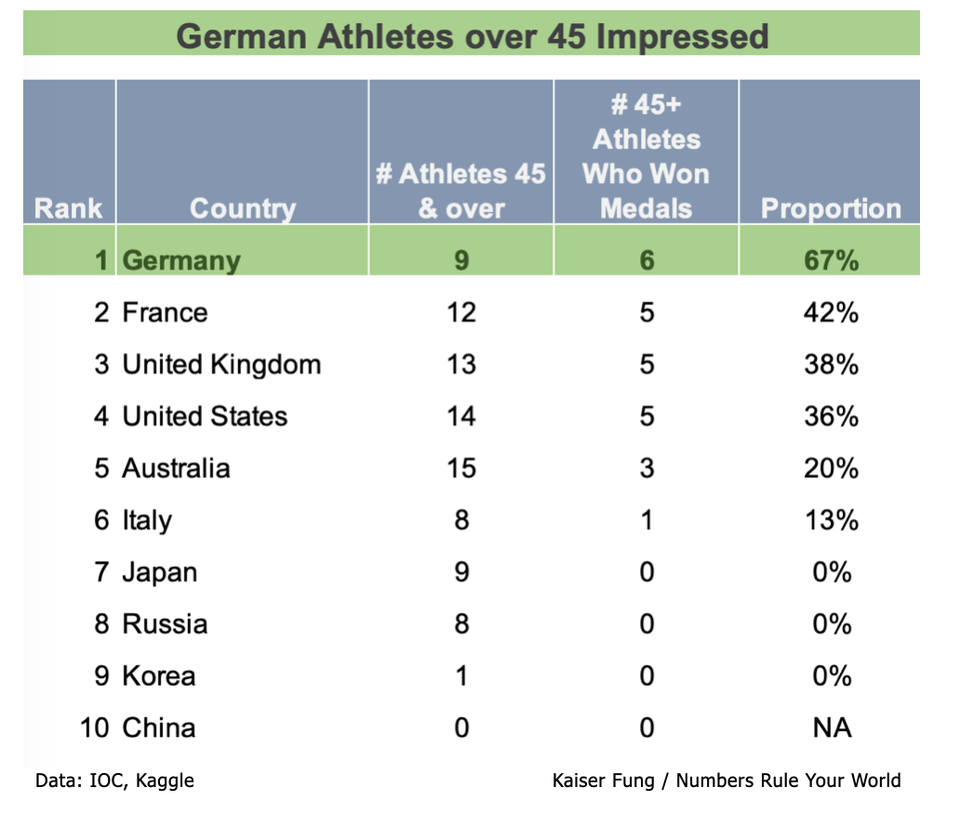
Big Data Demo of how data can tell any story you want, ode to Tokyo Kaiser completes a challenge: come up with ways to rank any country #1 in the Tokyo Olympics.
Models Primer on Regression Adjustments 1 Kaiser starts a series of posts about regression adjustments.
Big Data Round 2: 10 Ways to Rank the Rio Summer Olympics Kaiser finds another set of 10 metrics that can be used to rank any country top of the medals table.
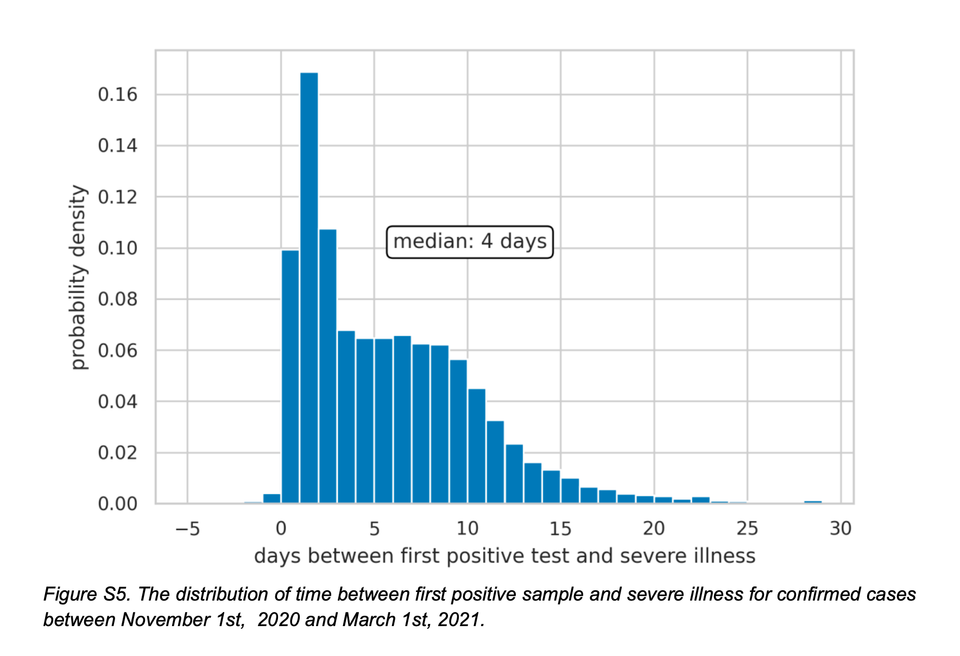
Bias Further adventures of case-counting windows Kaiser discusses several observations from the Israel booster study.
ray vella Displaying convoluted indices Kaiser shows how a small change in structure clarifies comparisons on a data visualization project.