Junk Charts
  • About
  • RSS
  • Posts by Year
  • Posts by Keywords
Sign in Subscribe

Archive: 2025

How hard can counting be?
Analytics-business interaction

How hard can counting be?

How hard can counting be? Reflections on the jump in homeless in the US
Read More
The science of counting more people using fewer people
Aggregation

The science of counting more people using fewer people

Trying to count more with less
Read More
Was Debrina Kawam homeless?
Crime

Was Debrina Kawam homeless?

Was Debrina Kawam homeless?
Read More
Two challenging charts showing group distributions
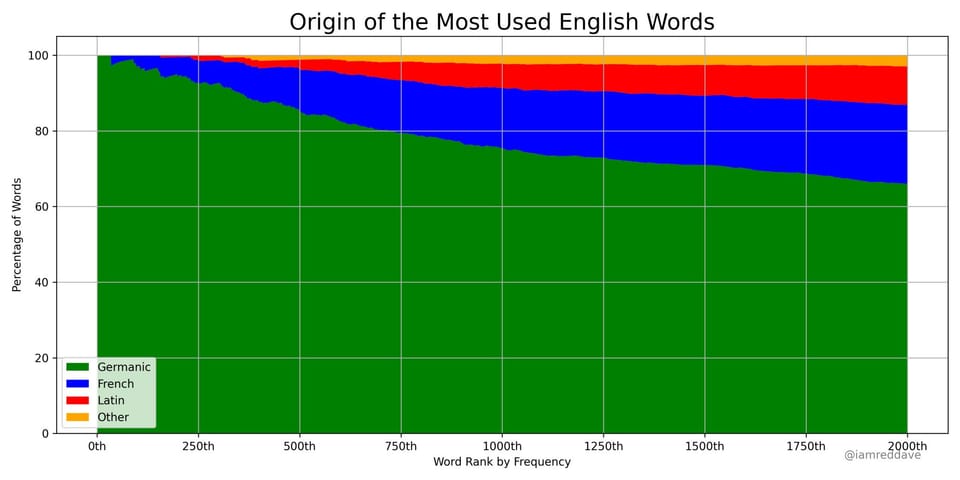
Area chart

Two challenging charts showing group distributions

Two complex charts that show subgroup distributions of data
Read More
Simple presentations
Axis

Simple presentations

In the previous post, I looked at this chart that shows the
Read More
On the second day of congestion pricing...
Analytics-business interaction

On the second day of congestion pricing...

What happened on the second day of congestion pricing in Manhattan
Read More
Page 1 of 15 Older Posts →
Junk Charts © 2025
  • BOOKS
  • COURSES
  • PRESS
  • CONSULTING
  • COACHING
  • CONTACT
Powered by Ghost