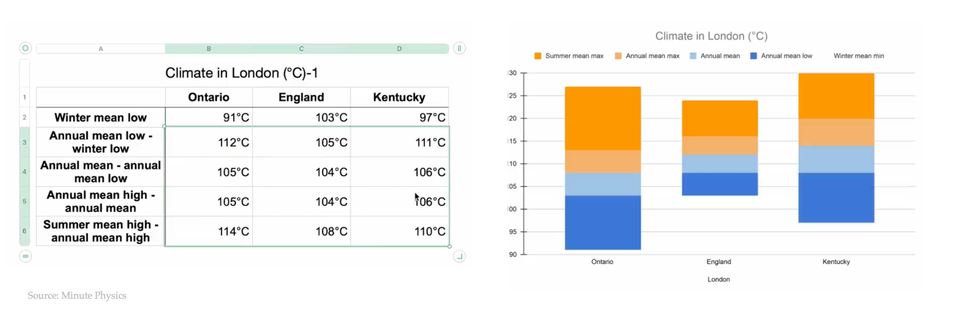
Aggregation Making major things easy, and minor things hard Making major things easy, and minor things hard
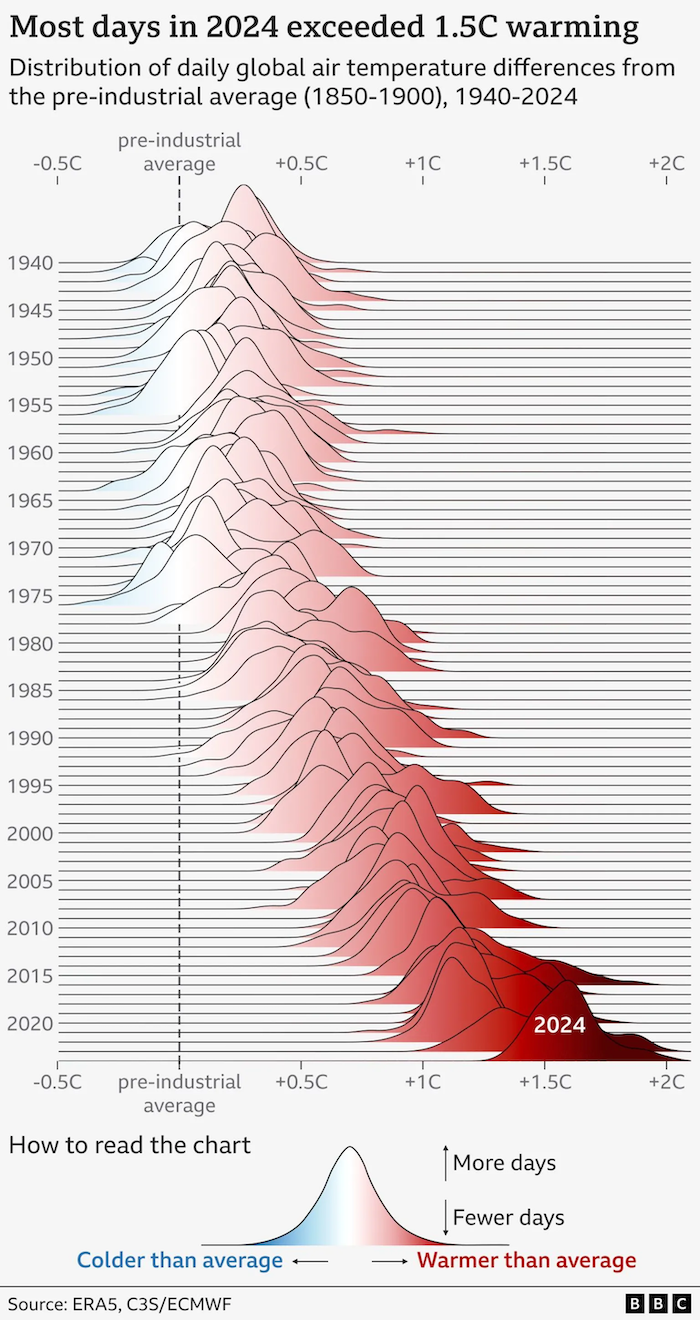
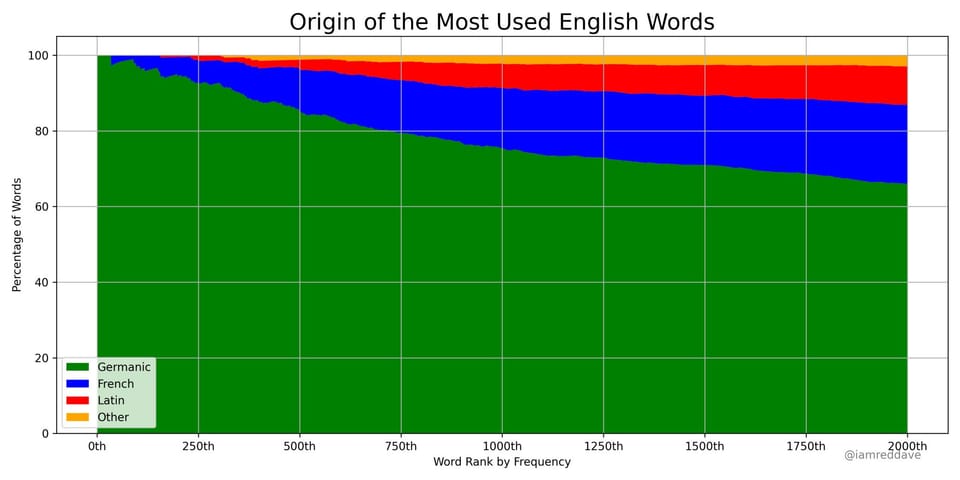
ridge plot Deliberately obstructing chart elements as a plot point These "ridge plots" have become quite popular in recent times.