ray vella Students demonstrate how analytics underlie strong dataviz Students demonstrate the value of analytics to data visualization
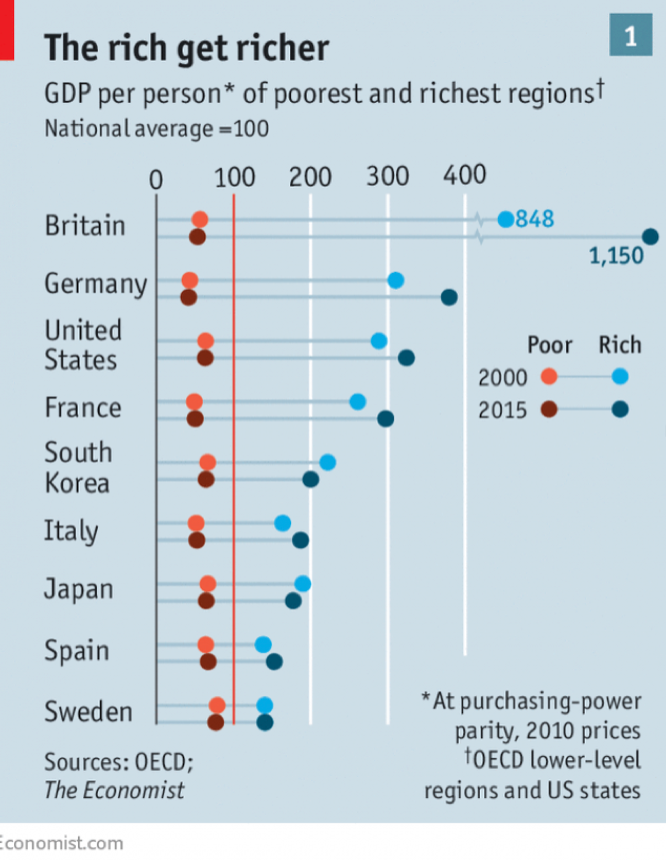
Bar chart The reckless practice of eyeballing trend lines The reckless practice of eyeballing trend lines
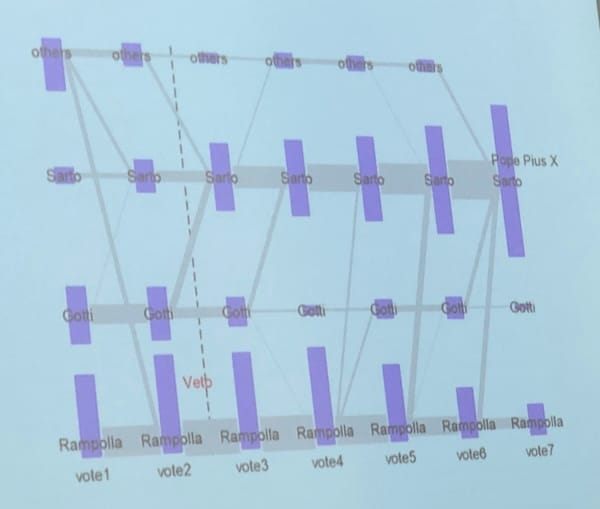
Aggregation Making major things easy, and minor things hard Making major things easy, and minor things hard