Junk Charts
About
RSS
Posts by Year
Posts by Keywords
Sign in
Subscribe
Bar chart
Aggregation
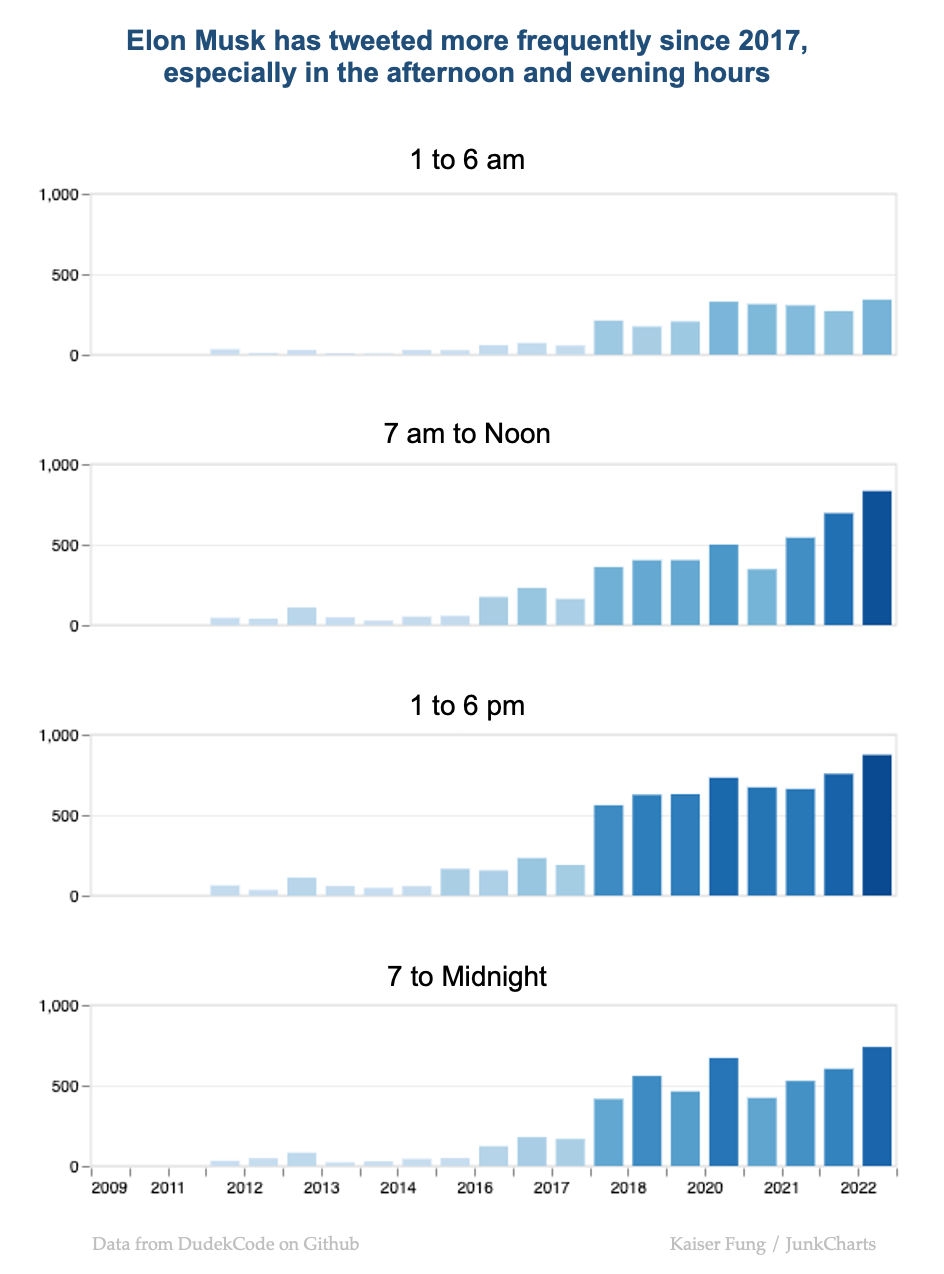
Organizing time-stamped data
Re-organizing the time stamps of Elon Musk tweets
Bar chart
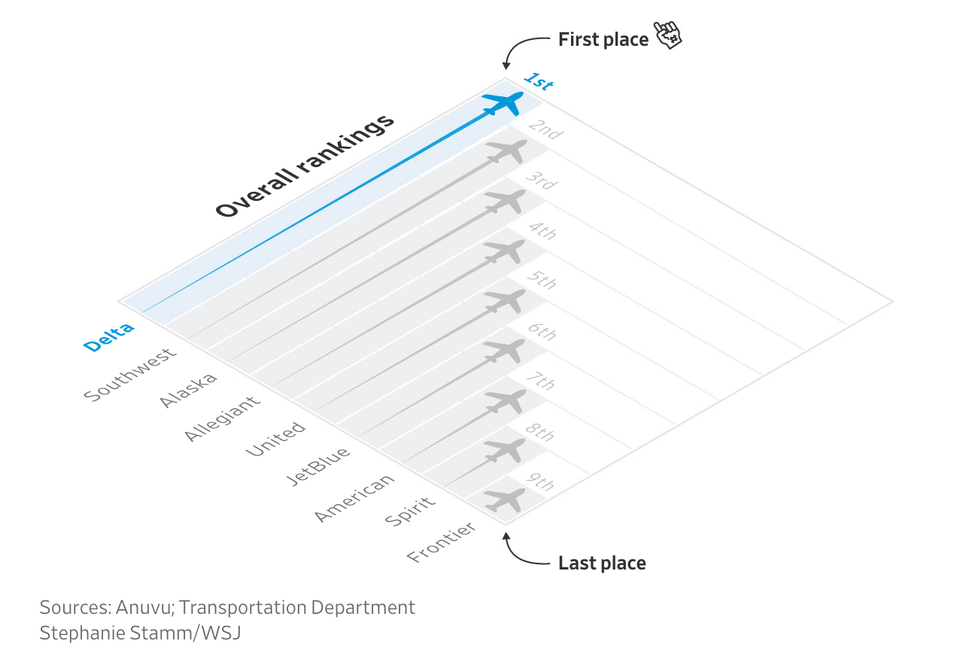
Ranks, labels, metrics, data and alignment
A rhombus shaped chart on airline rankings
Axis
Simple presentations
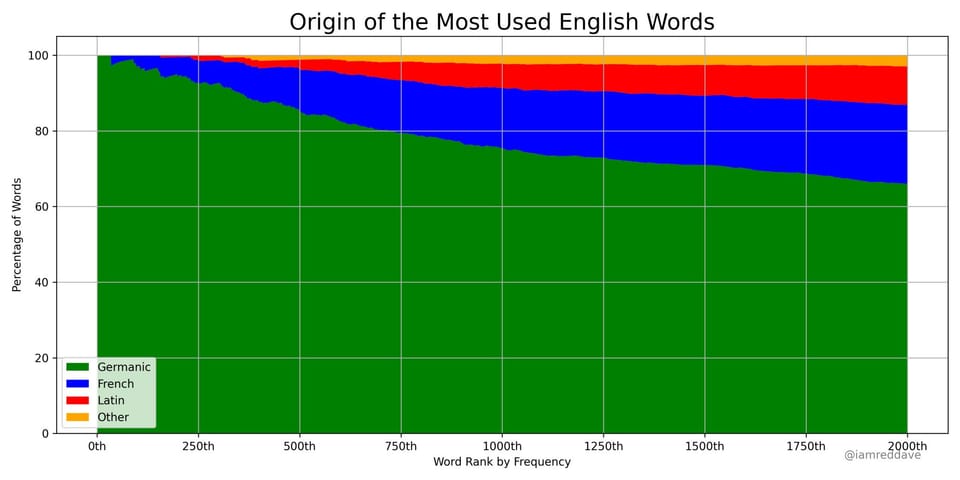
In the previous post, I looked at this chart that shows the
Boxplot
Five-value summaries of distributions
Using five numbers ot summarize data distributions
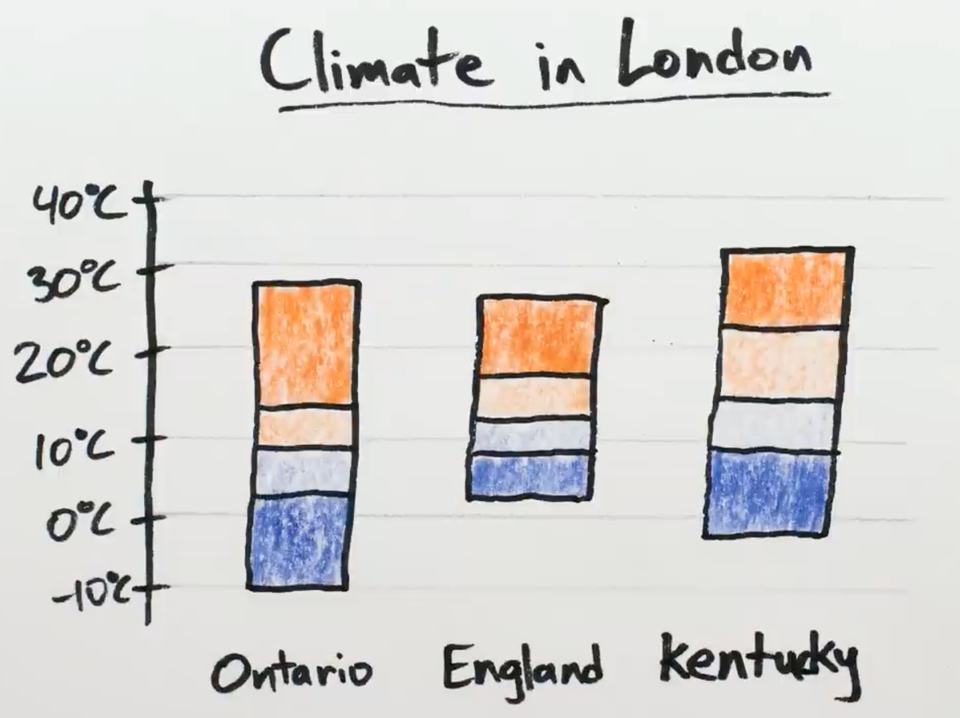
Aggregation
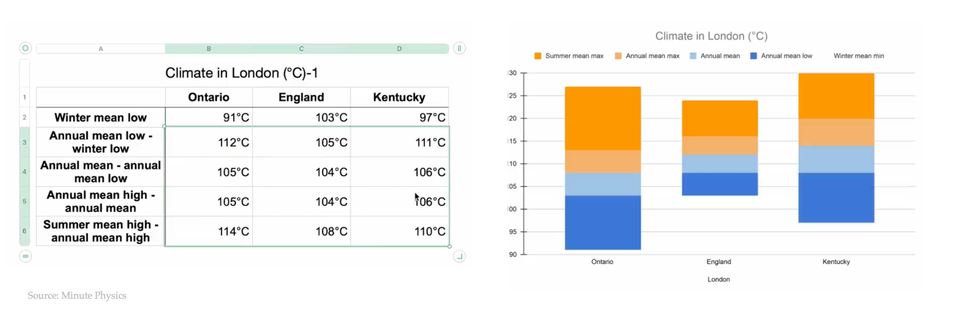
What is this "stacked range chart"?
Do we need this "stacked range chart"?
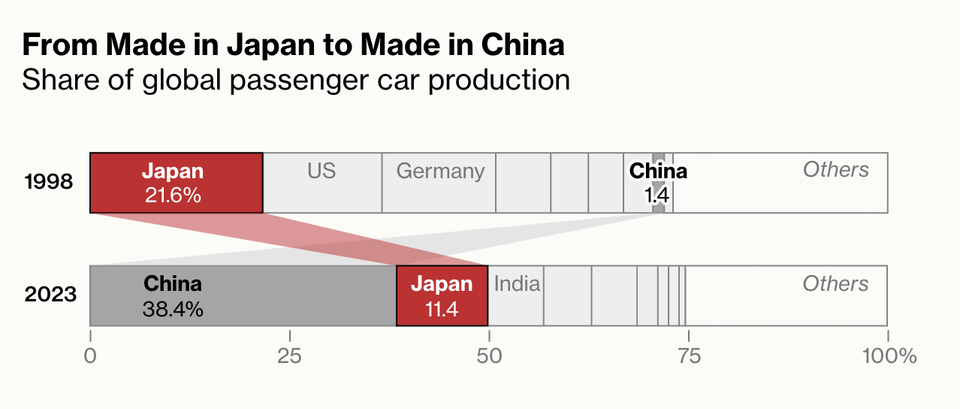
Bar chart
Fantastic auto show from the Bloomberg crew
Bloomberg Graphics put on an auto show
←
Newer Posts
Page 4 of 20
Older Posts
→