Junk Charts
About
RSS
Posts by Year
Posts by Keywords
Sign in
Subscribe
Comparability
radar chart
Data hunting on the radar (chart)
The data are not where you think they are
Table
Alternatives to radar chart 1
Sometimes, a table is all you need
radar chart
Four reasons to unplug radar charts
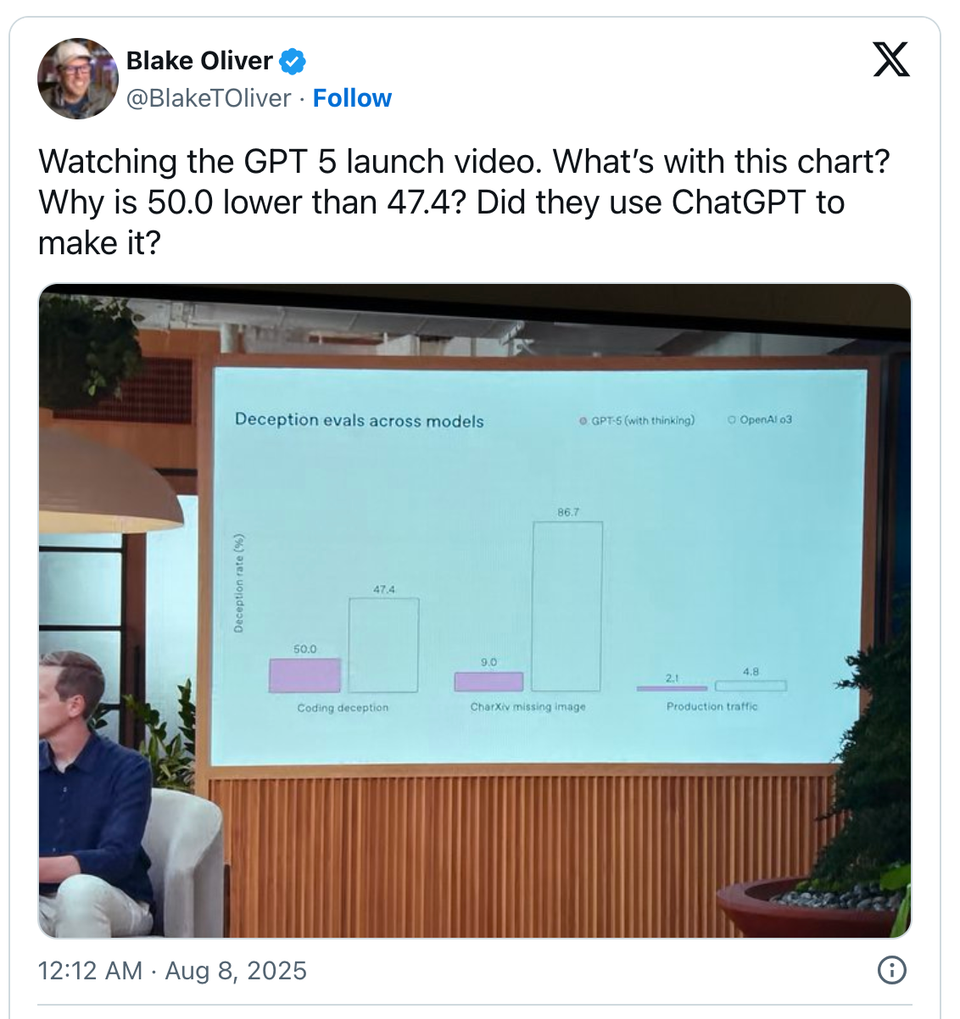
Ouch, ouch, ouch, ouch
openai
They won't tell you why they did it
Why do they do the crime?
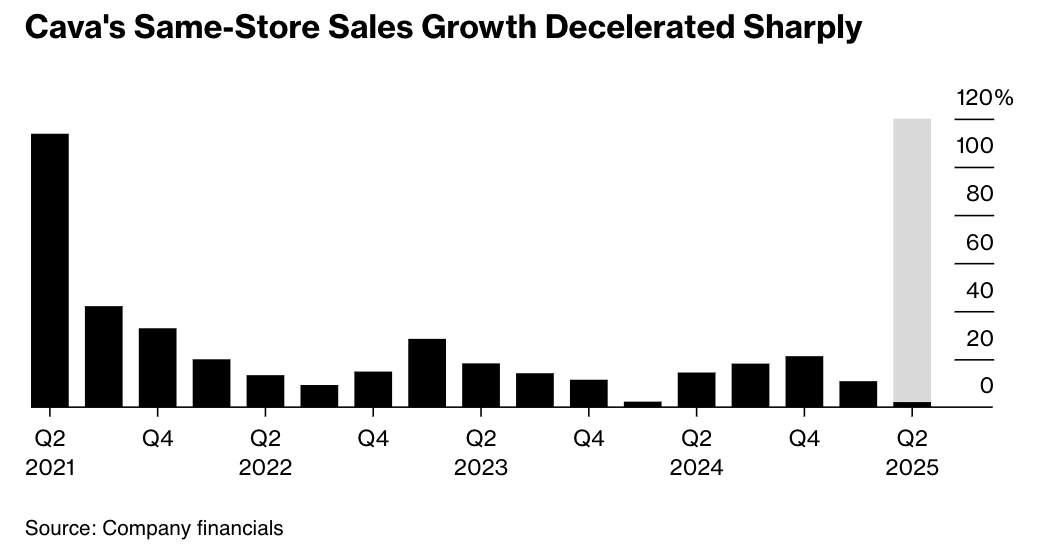
Bar chart
Simple is not always easy
Simple design is not always easy
Bar chart
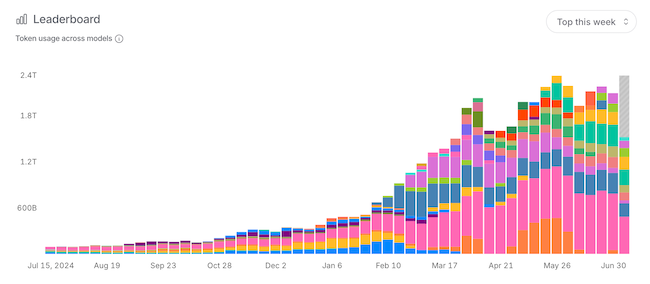
Color bomb
Color bomb in AI analytics
Page 1 of 9
Older Posts
→