Junk Charts
About
RSS
Posts by Year
Posts by Keywords
Sign in
Subscribe
Comparability
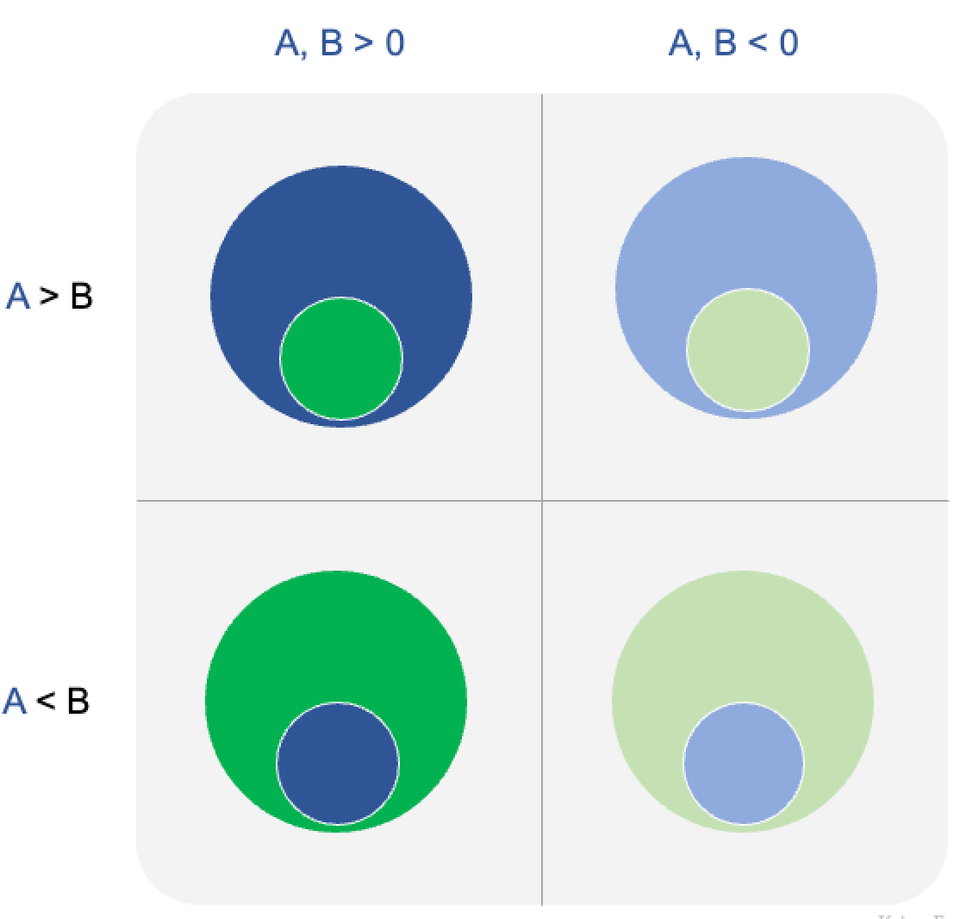
Bubble chart
Guide to using pairs of circles
A discussion of some design decisions
self-sufficiency test
Another test of self-sufficiency
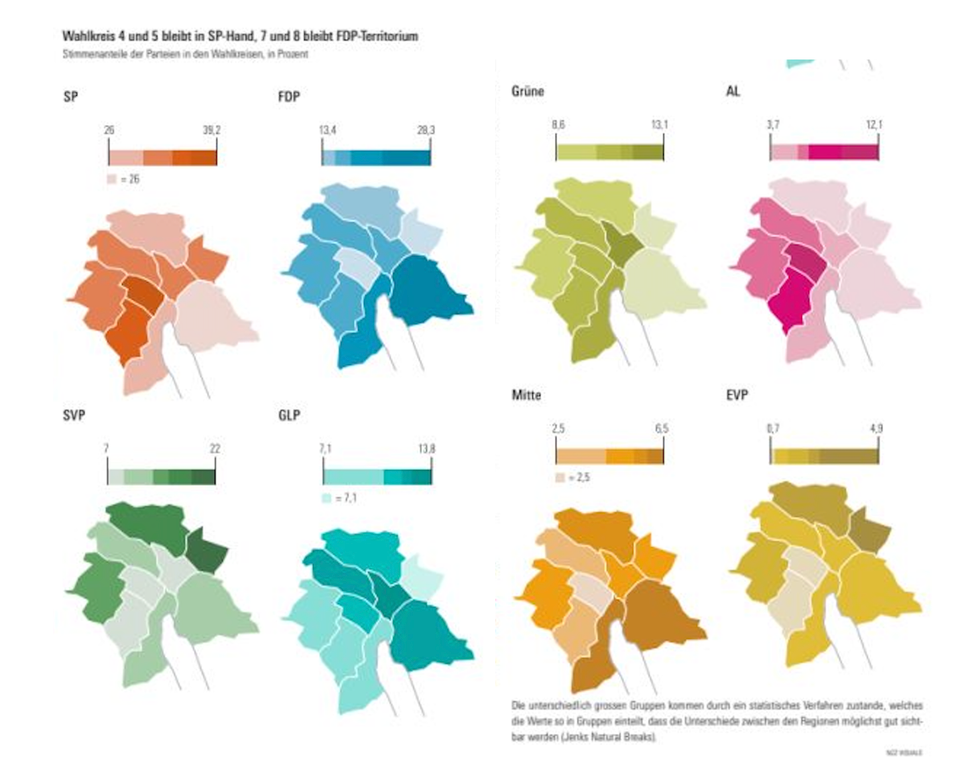
Reading an infographic of Swiss elections
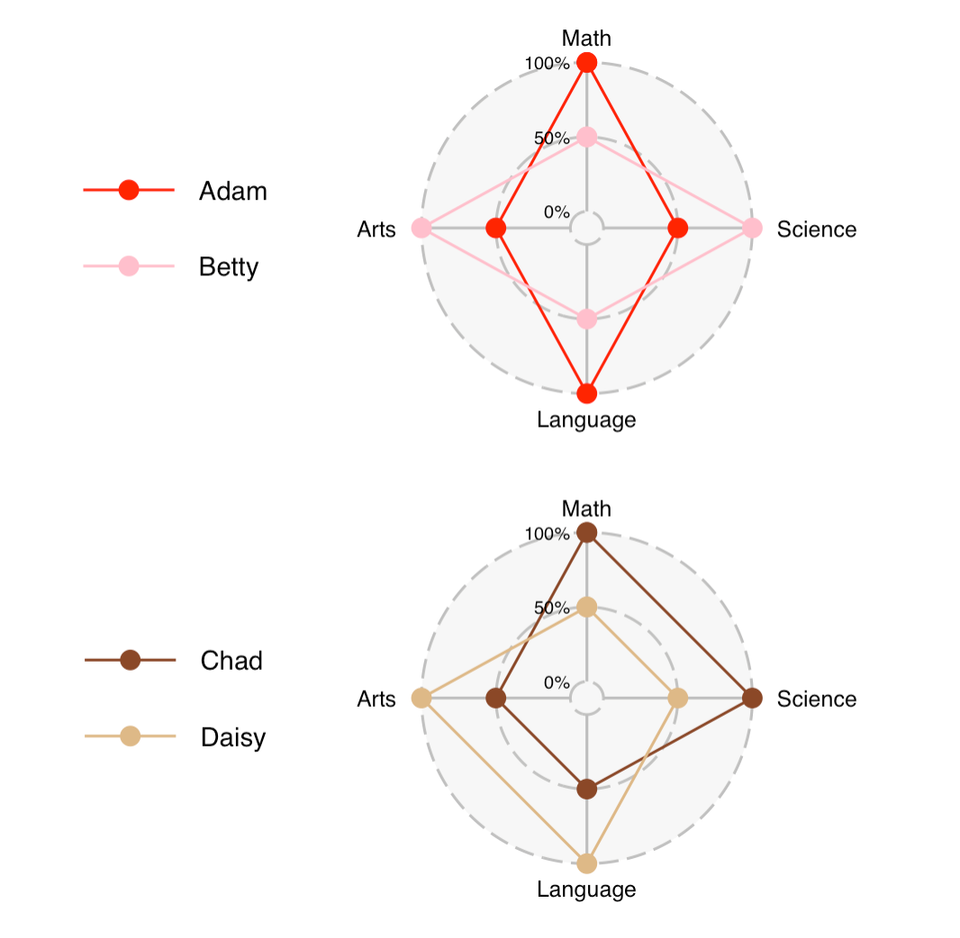
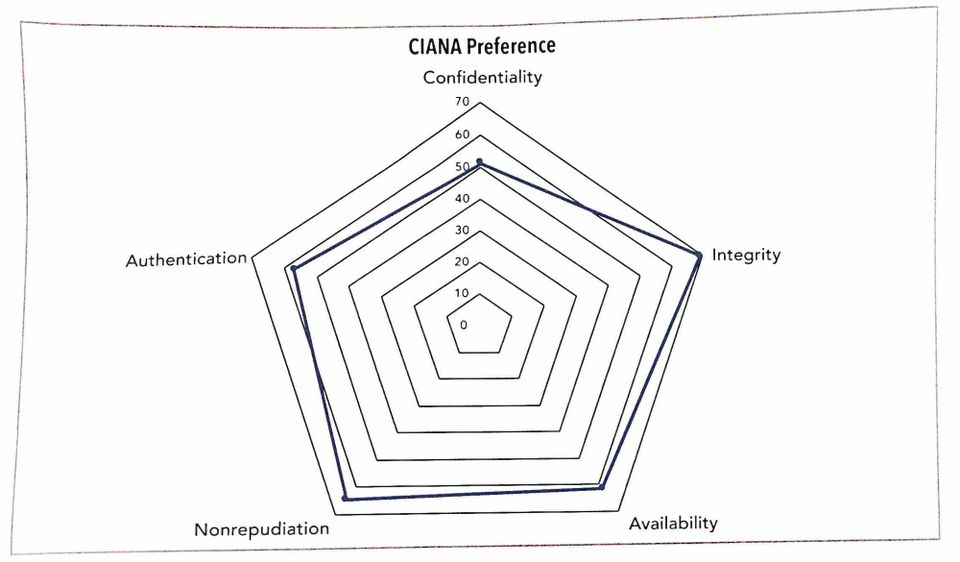
radar chart
Data hunting on the radar (chart)
The data are not where you think they are
Table
Alternatives to radar chart 1
Sometimes, a table is all you need
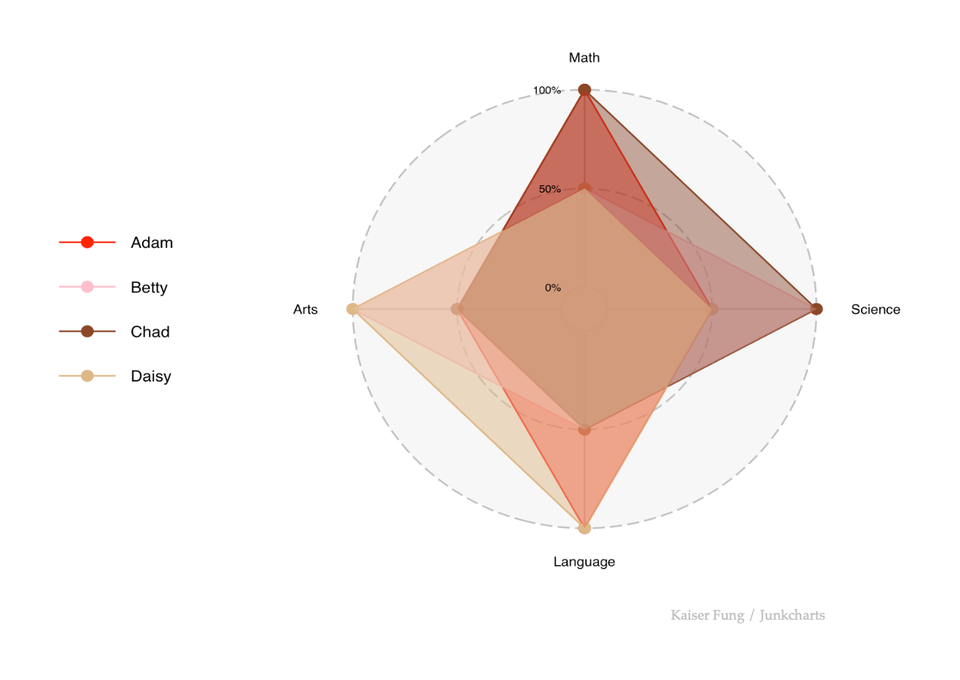
radar chart
Four reasons to unplug radar charts
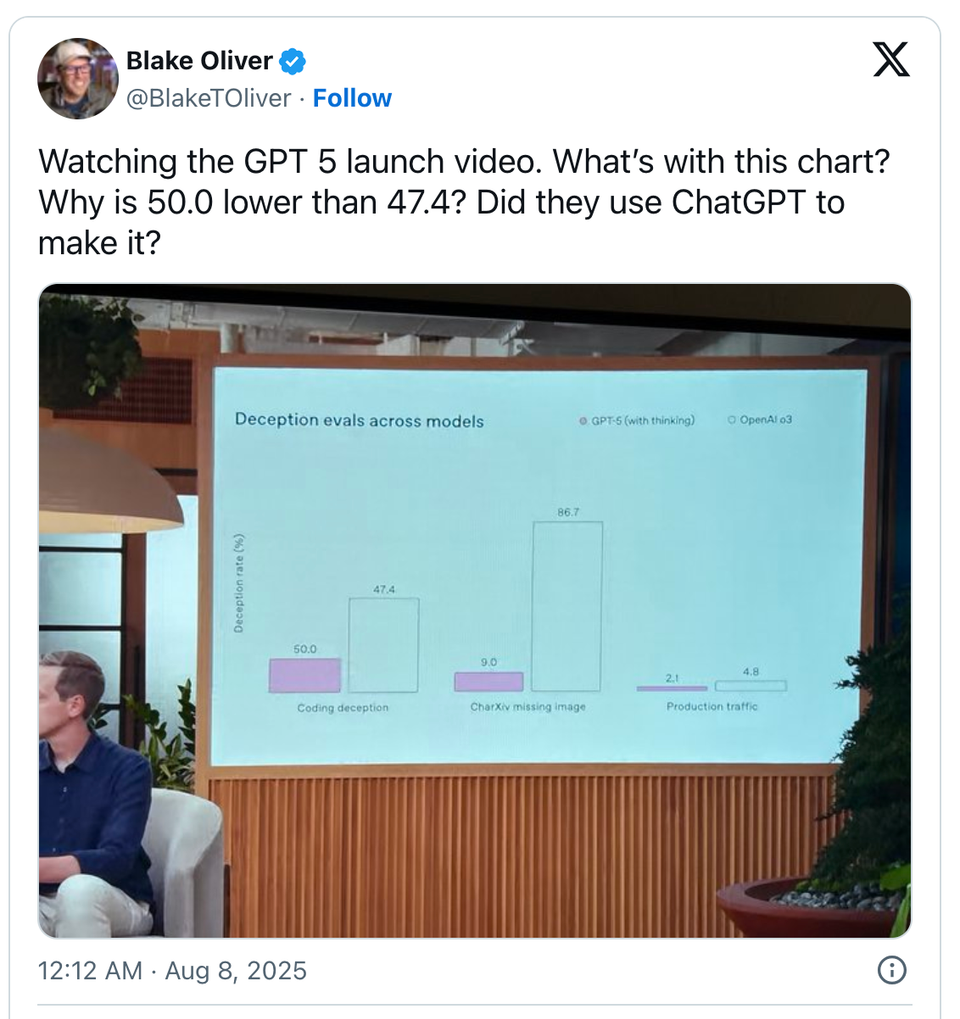
Ouch, ouch, ouch, ouch
openai
They won't tell you why they did it
Why do they do the crime?
←
Newer Posts
Page 2 of 11
Older Posts
→