Junk Charts
  • About
  • RSS
  • Posts by Year
  • Posts by Keywords
Sign in Subscribe

Comparability

Students demonstrate how analytics underlie strong dataviz
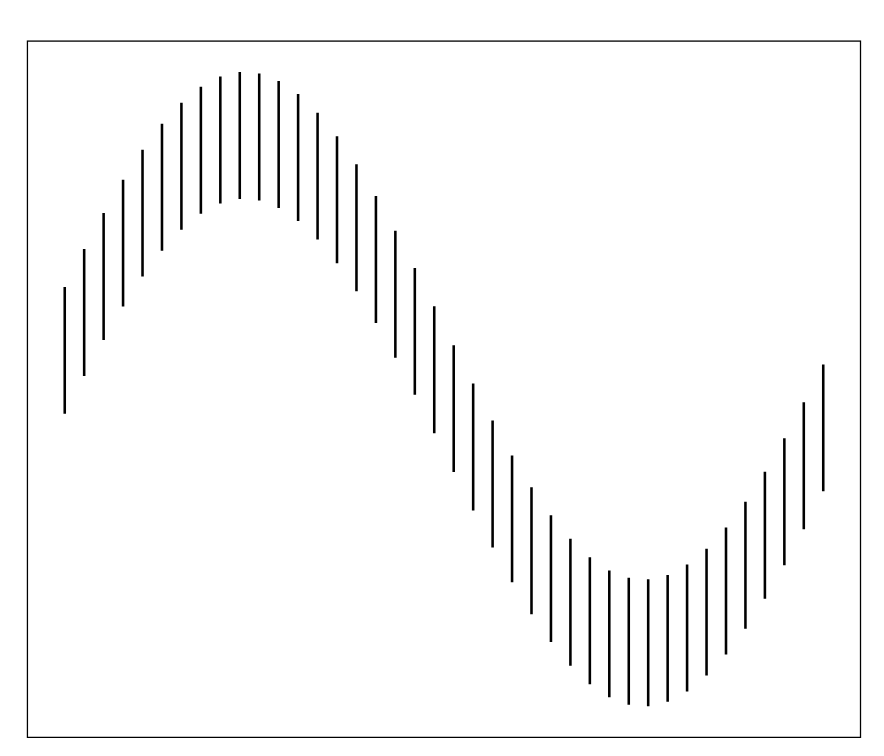
ray vella

Students demonstrate how analytics underlie strong dataviz

Students demonstrate the value of analytics to data visualization
Read More
The line-angle illusion
Area chart

The line-angle illusion

We fail to judge the distance between two lines on a chart.
Read More
Hammock plots
hammock plot

Hammock plots

Matthias Schonlau introduces the hammock plot.
Read More
Deliberately obstructing chart elements as a plot point
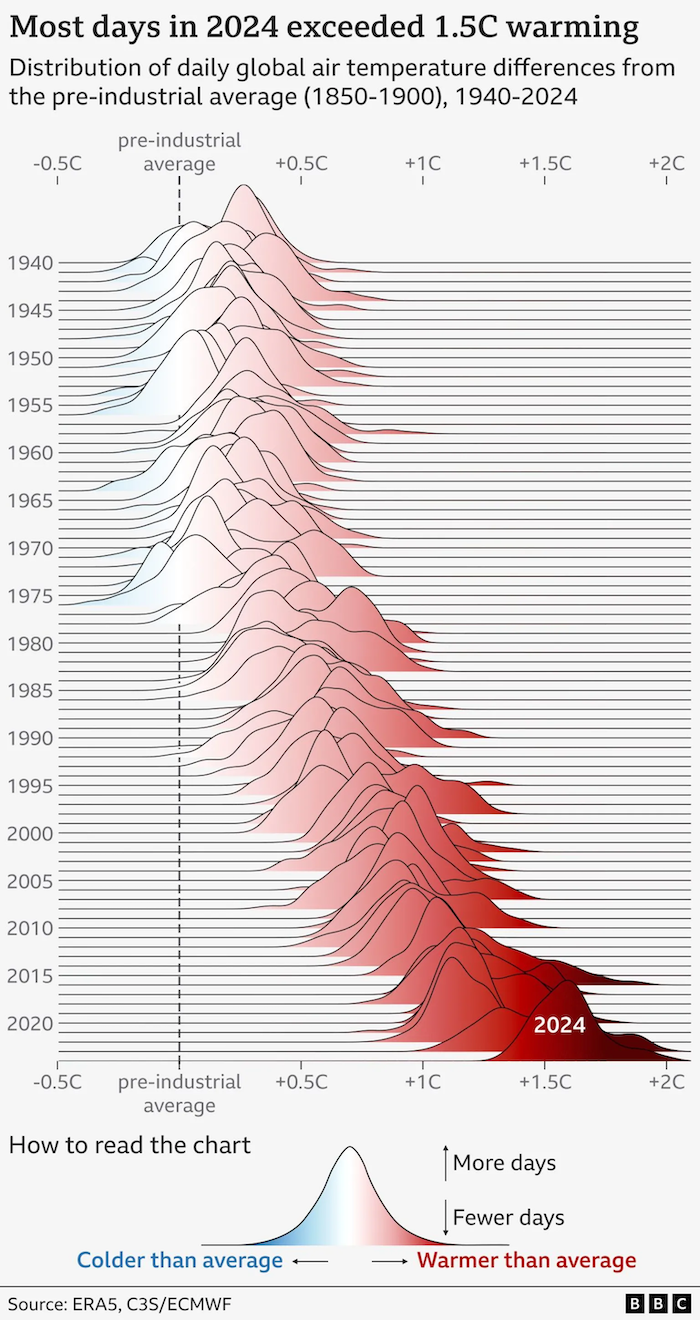
ridge plot

Deliberately obstructing chart elements as a plot point

These "ridge plots" have become quite popular in recent times.
Read More
Election coverage prompts good graphics
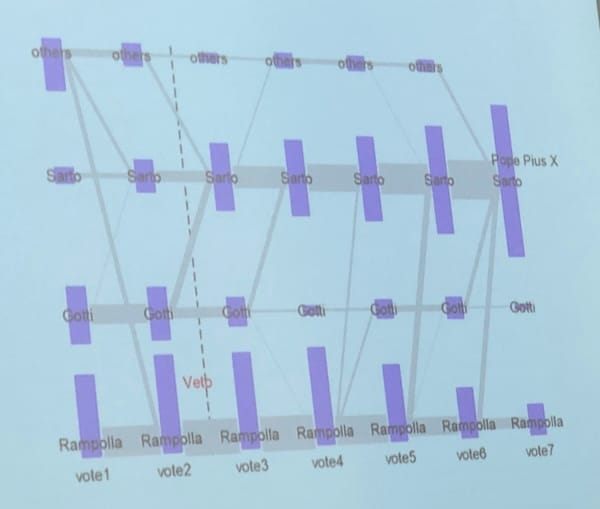
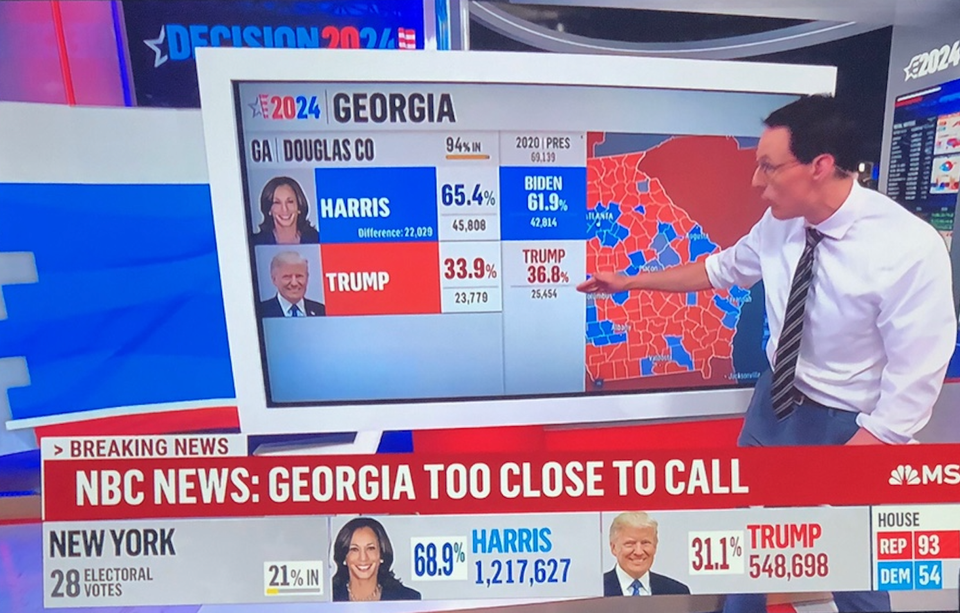
Aggregation

Election coverage prompts good graphics

Election coverage brings out the best of interactive graphics
Read More
Using disaggregation in dataviz
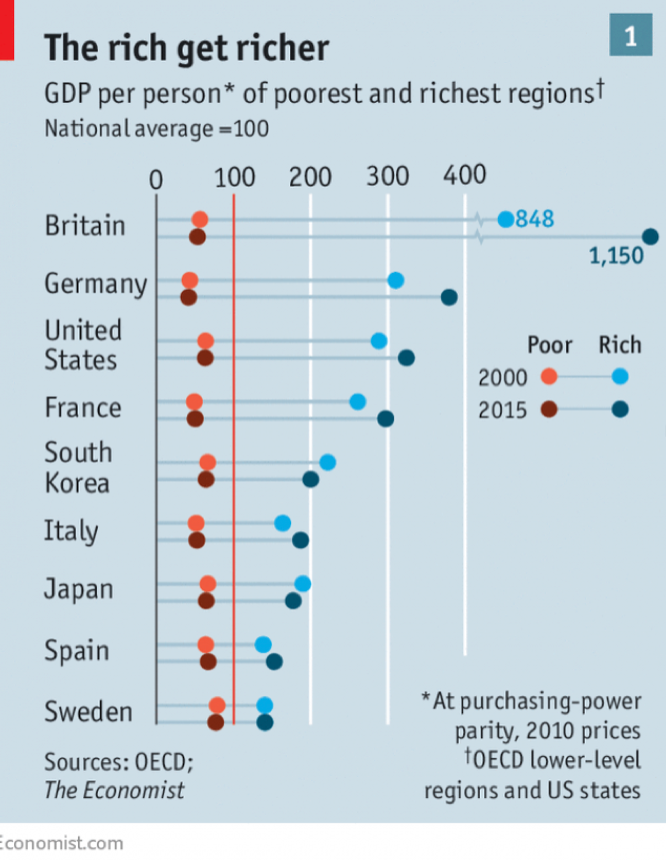
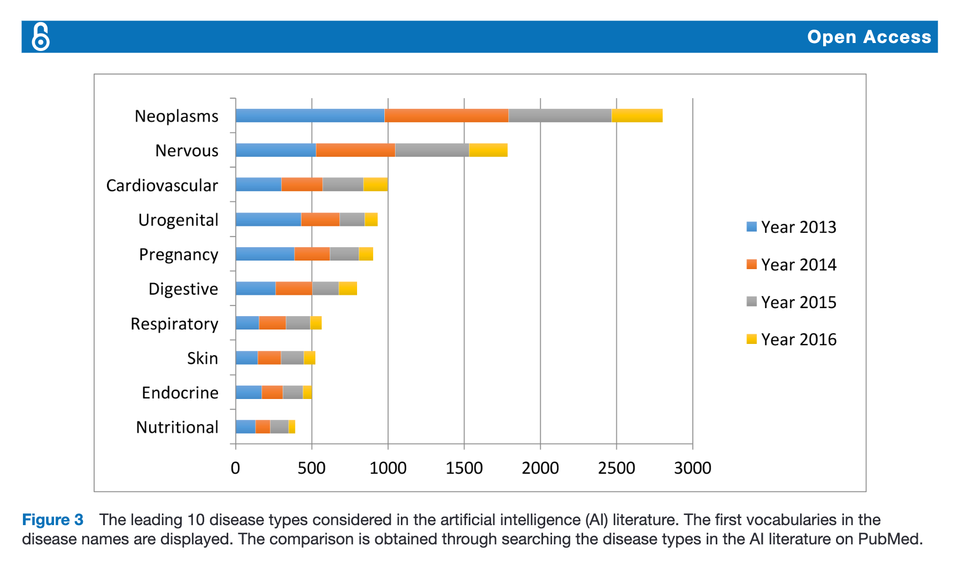
Aggregation

Using disaggregation in dataviz

Disaggregating data can be very useful when making charts
Read More
← Newer Posts Page 2 of 9 Older Posts →
Junk Charts © 2026
  • BOOKS
  • COURSES
  • PRESS
  • CONSULTING
  • COACHING
  • CONTACT
Powered by Ghost