Junk Charts
  • About
  • RSS
  • Posts by Year
  • Posts by Keywords
Sign in Subscribe

Comparability

Visualizing citation impact
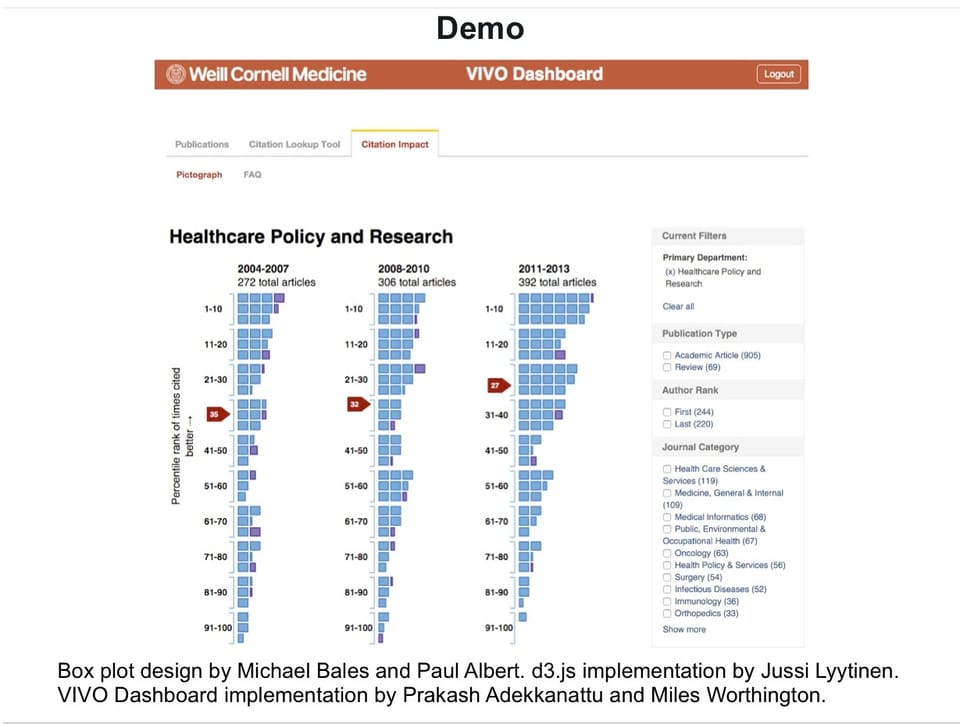
Comparability

Visualizing citation impact

Michael Bales and his associates at Cornell are working on a new
Read More
Your charts need the gift of purpose
Sorting

Your charts need the gift of purpose

A case of doubly inverted scales
Read More
Exquisite chart by-of-for academics
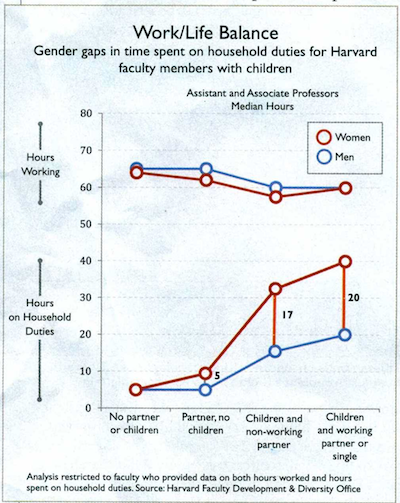
Aggregation

Exquisite chart by-of-for academics

This chart published in Harvard Magazine has won my heart. It is
Read More
Spatial perception: on the chart and in real life
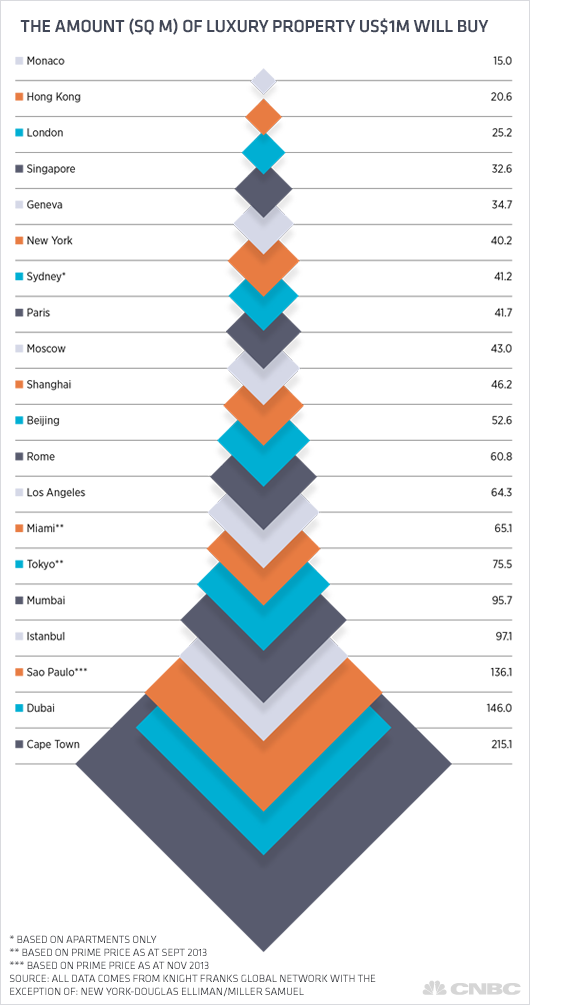
Area chart

Spatial perception: on the chart and in real life

A twitter follower @mdjoner felt that something is amiss with the squares
Read More
Four numbers say little, even on a busy chart
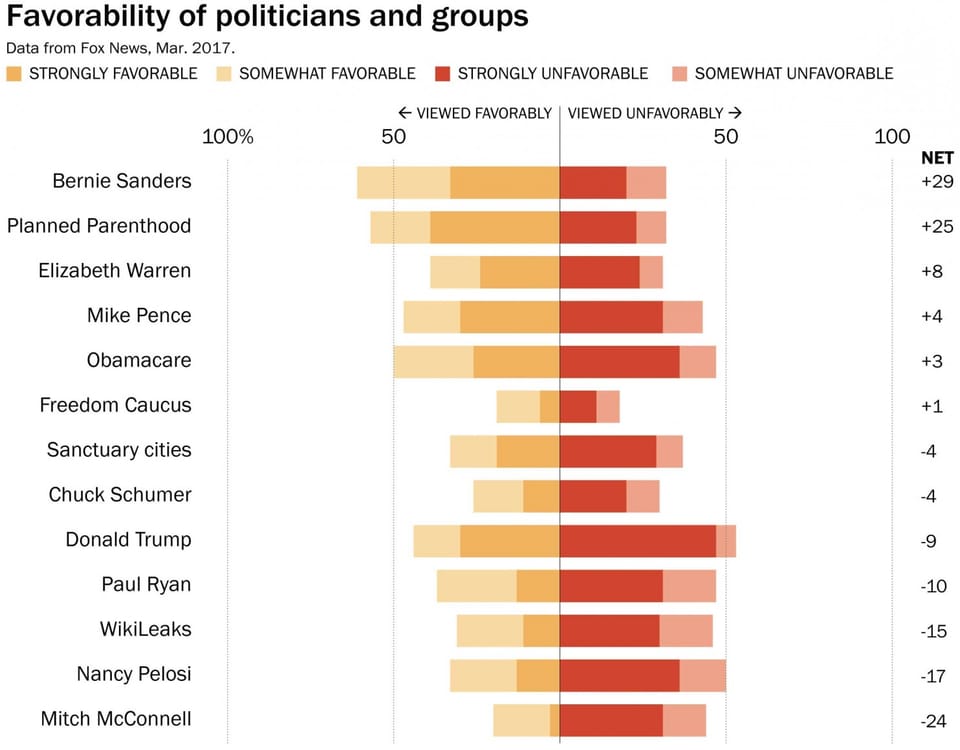
Axis

Four numbers say little, even on a busy chart

Reader Robert J. calls this a "really bad" chart (link)
Read More
Insufficiency and illusions
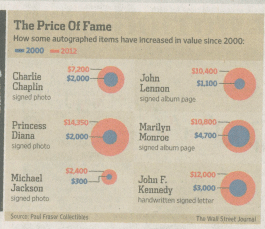
Bubble chart

Insufficiency and illusions

This WSJ graphic gives me a reason to talk about the self-sufficiency
Read More
← Newer Posts Page 4 of 9 Older Posts →
Junk Charts © 2026
  • BOOKS
  • COURSES
  • PRESS
  • CONSULTING
  • COACHING
  • CONTACT
Powered by Ghost