Junk Charts
  • About
  • RSS
  • Posts by Year
  • Posts by Keywords
Sign in Subscribe

data graphics

Pie charts and self-sufficiency
Business

Pie charts and self-sufficiency

A series of pie charts is used to demonstrate a trend
Read More
Do better
Covid-19

Do better

Kaiser reads some misleading NEJM data graphics.
Read More
Open questions of the pandemic, part 2
Aggregation

Open questions of the pandemic, part 2

Kaiser continues to discuss open questions of the pandemic, including questions raised by a recent White House graphic.
Read More
Excel is the graveyard of charts, no!
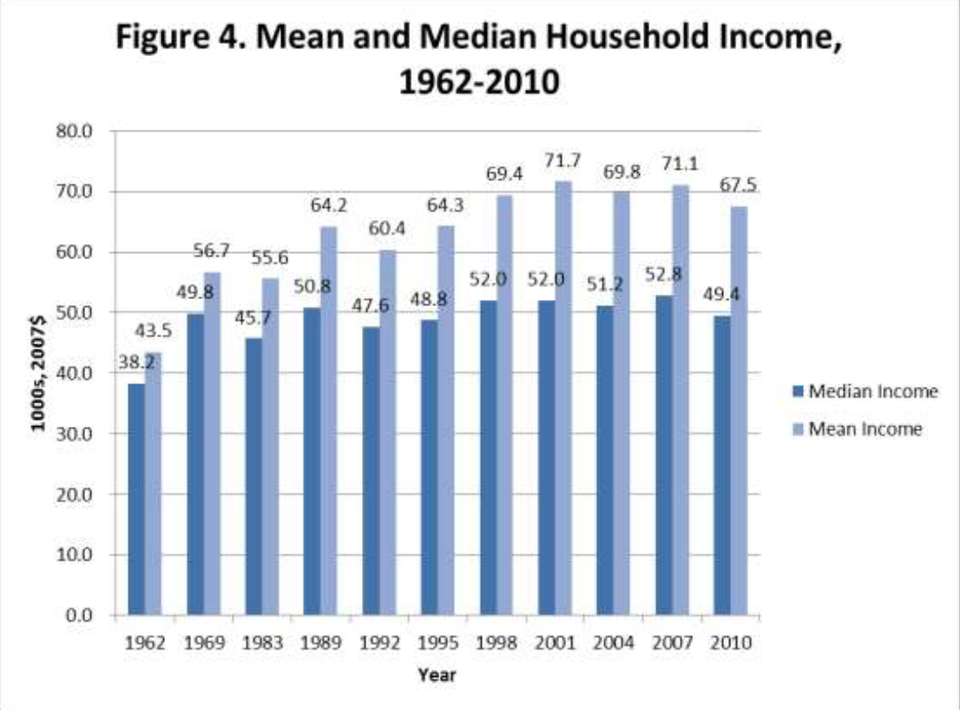
Bar chart

Excel is the graveyard of charts, no!

Kaiser Fung, creator of Junk Charts blog and founder of Principal Analytics Prep, encourages Excel users to work harder at making nice data graphics.
Read More
Page 1 of 1
Junk Charts © 2026
  • BOOKS
  • COURSES
  • PRESS
  • CONSULTING
  • COACHING
  • CONTACT
Powered by Ghost